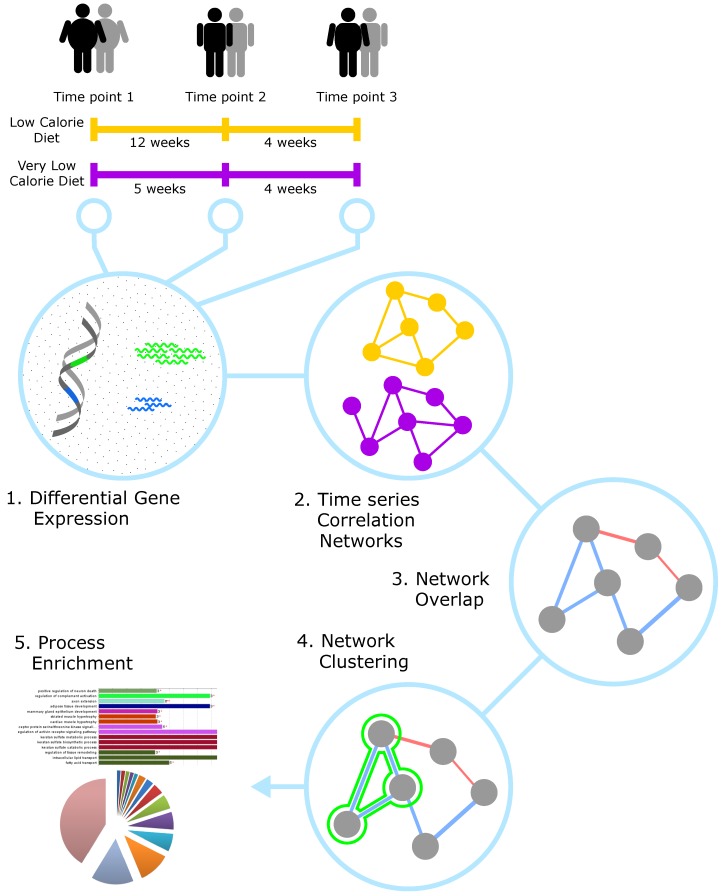
Figure 1.
Network biology analysis workflow. (1) The time series expression data from the time points is normalised and differential expression analysis is performed. (2) Correlation networks are constructed on the time series for each diet respectively. (3) The overlap network is generated from the two networks showing the correlations which are shared between the two diets. (4) Community clustering is performed to find clusters of genes which are showing the most similar expression patterns. (5) The overlap network and the gene clusters are then used for process enrichment to find the affected cellular processes.

