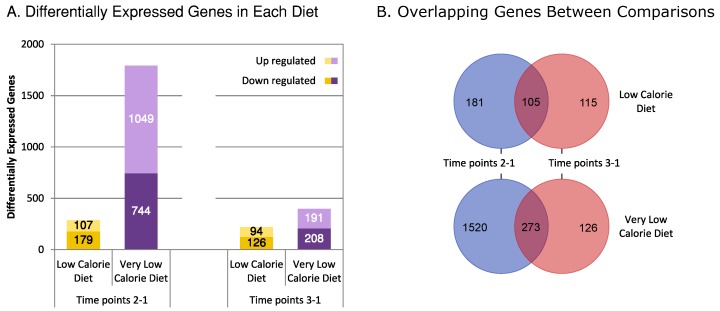
Figure 2.
The number of differentially expressed genes in each diet. (A) The number of up and downregulated genes along the two time point comparisons. Time points 2-1: After Weight Loss—Before Weight Loss, and time points 3-1: After Weight Maintenance—Before Weight Loss; (B) the number of differentially expressed genes overlapping between the two comparisons within each diet.

