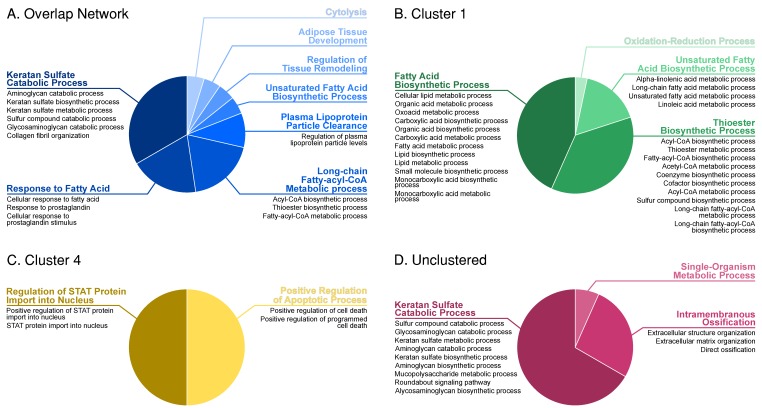
Figure 5.
Gene ontology term pie charts constructed using the ClueGO results. Each pie chart contains major GO terms as slices, with sub-terms listed underneath each. (A) GO term pie chart for the overlap network; (B) GO term pie chart for Cluster 1; (C) GO term pie chart for Cluster 4; (D) GO term pie chart for un-clustered gene pairs.

