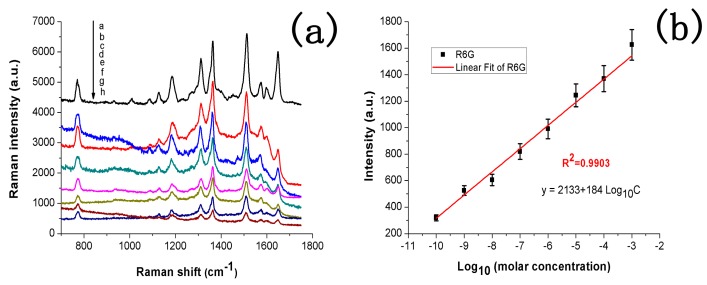
Figure 4.
(a) SERS signals of R6G, at different concentrations ranging from 10−3 to 10−10 mol/L, absorbed on AgNP-decorated PS PC samples. (b) Corresponding linear fitting of Raman intensity at 1512 cm−1 with logarithmic R6G concentration. Error bars present the standard deviation obtained from three independent measurements. (λexcitation 633 nm, acquisition time 3 s, laser power 1 mW).

