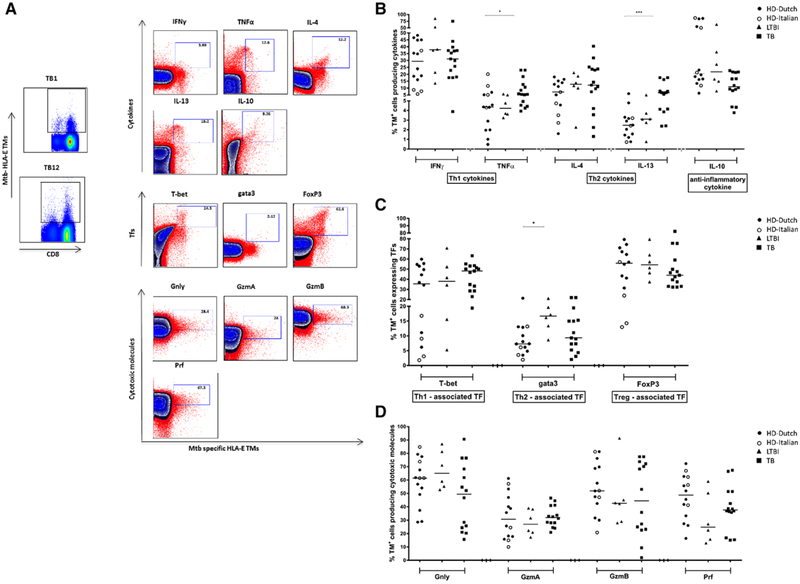
Figure 3.
HLA-E/Mtb TM+ CD8+ T cells cytokine production, transcription factors, and cytolytic molecules. PBMCs were expanded using mitogenic stimulation, followed by magnetic bead separation of CD8+ T cells and specific peptide stimulation. Cells were stained with TMs first before staining with cell surface markers and intracellular cytokine staining. Events count below <1000 were not included for analysis of HLA-E restricted CD8+ T cells’ properties; 14 out 26 HDs (10 Dutch, 4 Italian), 6 out 13 LTBI, 15 out 17 active TB subjects were analyzed. P-values were calculated using a two-way ANOVA non-parametric Dunnet’s test multiple comparison of LTBI and TB with HD control group. Black circles: Dutch HD; Open circles: Italian HD; black triangles: LTBI; black squares: TB patients. (A) A representative plot from 21 independent experiments with —two to four samples per experiment show HLA-E restricted CD8+ T cells upon p62 and p68 peptide stimulation in a TB patient, dot plots show TM+ cells producing cytokines; transcription factors and cytotoxic molecules. Blue indicates expanded cells not re-stimulated with specific peptides (unstimulated control), red is the sample following overnight peptide stimulation. Data are shown for total CD8+ T cells, with the tetramer positive population on the x-axis. Donor TB1 is shown for IFN-γ, TNF-α, IL-4, IL-13 and the transcription factors, whereas donor TB12 is shown for IL-10 and the cytolytic molecules. (B) Frequency of TM+ CD8+ T cells producing IFNγ, TNFα, IL-4, IL-13, and IL-10 upon p62 and p68 peptide stimulation in HDs, LTBIs and TB samples. 15 out 17 TB patients were analyzed, only for IL-10 (included in Panel B) 14 out 17 TB patients were evaluated. (C) Frequency of TM+ CD8+ T cells expressing T-bet, gata3 and FoxP3 transcription factors upon expansion in HDs, LTBI and TB subjects. (D) Frequency of TM+ CD8+ T cells producing Granulysin (Gnly), Granzyme A (GzmA), Granzyme B (GzmB) and Perforin (Prf). upon expansion in HDs, LTBIs and TB samples. In Panel B (including cytotoxic molecules) 14 out 17 active TB patients were analyzed. Each symbol represents one sample. Data shown in B and D are pooled from 21 independent experiments with —two to four patients per experiment. the p-value was calculated using a two-way ANOVA with Dunnets’multiple comparison correction *p<0.05, **p<0.01, ***p<0.001.

