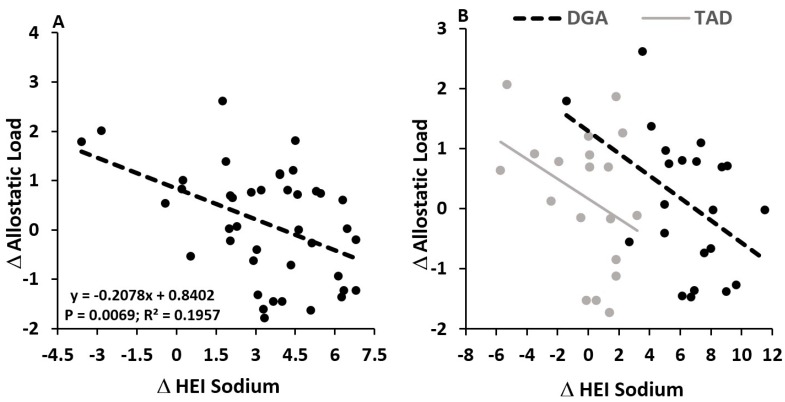
Figure 2.
Independent of diet group, increasing the healthy eating index (HEI) for sodium consumption associated with reductions in the 8 week allostatic load (A). In the right hand figure (B), data and regression lines are presented for each diet group (DGA vs. TAD), showing that, for a given magnitude of delta HEI sodium, the DGA group had a higher magnitude of allostatic load change. No statistical interaction between diet group and change in HEI sodium was observed (p = 0.7909), suggesting that regression slopes between DGA and TAD groups were not different, with both demonstrating an inverse association between delta HEI sodium and delta allostatic load. Data and regression lines presented in A and B were statistically adjusted for age, education, BMI, and pre-intervention allostatic load.

