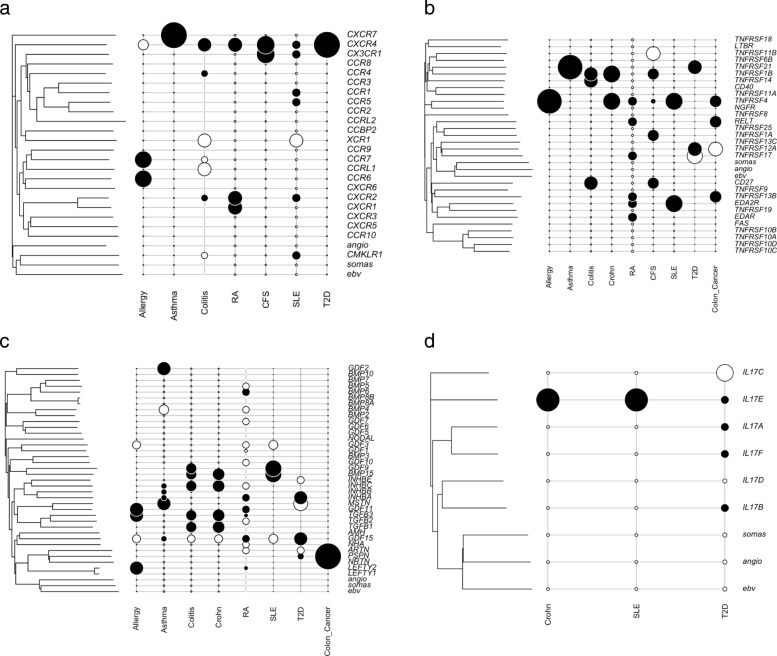
Fig. 3.
Phylogenetic correlation analysis for gene families: a the chemokine receptor family; b the TNF receptor family; c the TGF– β family; d the IL–17 family. In each figure, the phylogenetic tree for the protein sequences of the gene family constructed using neighbour–joining is shown on the left side. The sequences EBV (human EBV-induced G protein-coupled receptor), angio (human type-1 angiotensin II receptor isoform) and somas (human somatostatin receptor) are considered as outgroups. The scale bar refers to the branch lengths, measured in expected numbers of amino acid replacements per site. The significant association between diseases and genes of the gene family is shown on the right side. Large black circles represent up–regulated expression; small black circles represent down–regulated expression; large white circles represent up–regulated (gene body AND promoter) methylation; small white circles represent down–regulated methylation

