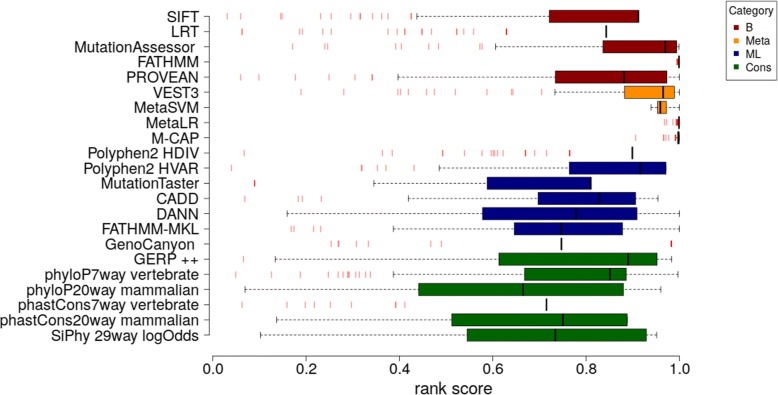
Fig. 2.
Distribution of rank scores for mutations with null residual activity. The boxplot show the distribution of the rank scores for all the predictors used by wANNOVAR. The red bars represent outliers. Predictor category label is B for “biologically based prediction method”, ML for “Machine Learning based prediction method”, Meta for “Meta prediction method” and Cons for “Conservation scoring tool”

