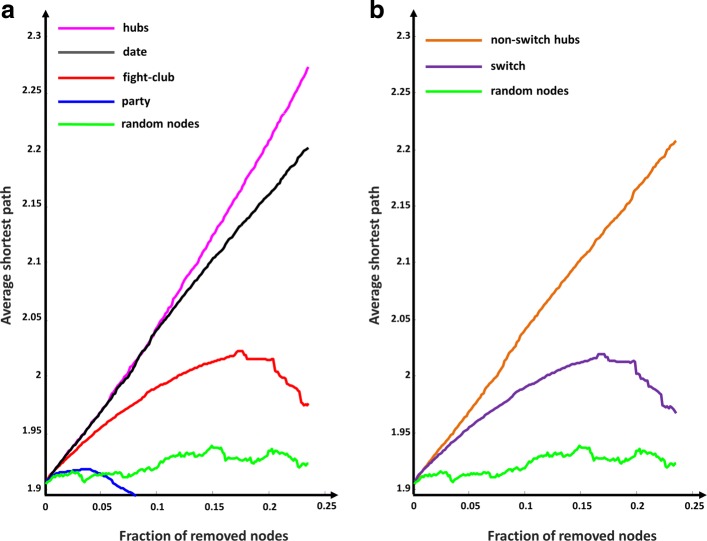
Fig. 11.
Robustness for GBM correlation network. a-b For each class of hubs, nodes are sorted by decreasing degree and the first 171 (i.e. the number of switch) sorted nodes are selected to be removed. Then, the cumulative node deletion is computed by class (i.e. total hubs, party hubs, date hubs, fight-club hubs, switch genes, and randomly chosen nodes). The x-axis represents the cumulative fraction of removed nodes with respect to the total number of network nodes that is 732, while the y-axis represents the average shortest path. Each curve corresponds to the variation of the average shortest path of the GBM correlation network as function of the removal of nodes specified by the color of each curve

