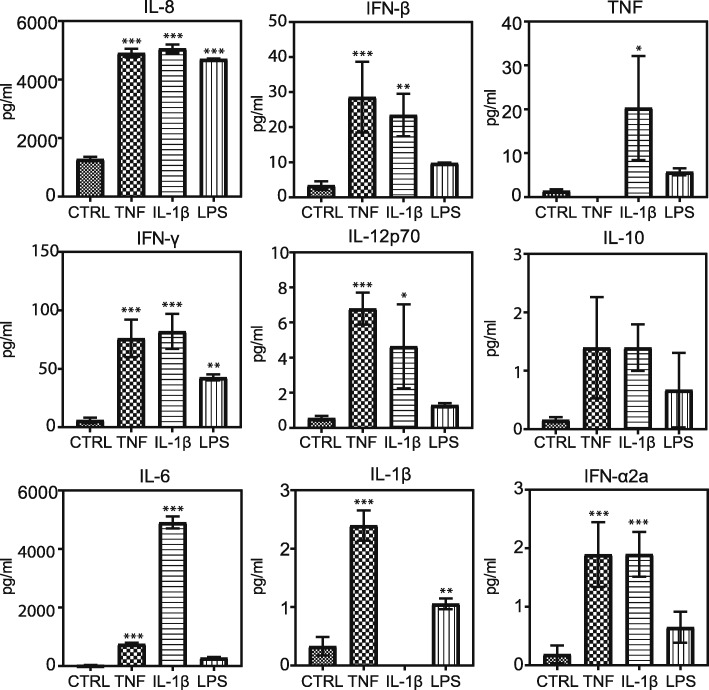
Fig. 3.
Supernatant cytokine and chemokine concentrations upon stimulating cells with TNF (100 ng/ml), IL-1β (100 ng/ml), and LPS (10 μg/ml) for 24 h. Data are represented as means ± SD of three biological replicates. One-way ANOVA with Dunnet’s post hoc test was used to test for significance in each group compared to the control (*P < 0.05, **P < 0.01, and ***P < 0.005)

