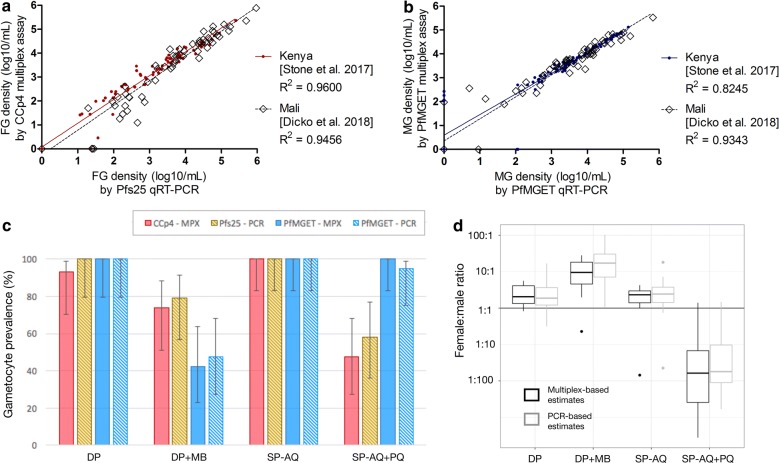
Fig. 4.
Performance of the multiplex-assay on clinical trial samples. a, b Agreement with previously measured gametocyte densities with single assays, using Pfs25 (a) and PfMGET (b) transcripts. The linear regression was fitted as follows [95% confidence interval]: for FG y = 0.9944 [0.9497–1.040]x + 0.0751 [− 0.0627 to 0.2130] [28], y = 1.033 [0.977–1.092]x − 0.2554 [0.4619–0.04893] [15] and for MG y = 0.8626 [0.7744–0.9507]x + 0.5919 [0.2802–0.9037] [28], y = 0.9217 [0.8633–0.9800]x + 0.3508 [0.1515–0.5500] [15]. c Gametocyte prevalence as determined by single or multiplex qPCR for four treatment arms (Dicko et al. 2018), 7 days after treatment with either DP, dihydroartemisinin–piperaquine (n = 15); DP + MB, dihydroartemisinin–piperaquine + methylene blue (n = 19); SP–AQ, sulfadoxine–pyrimethamine and amodiaquine (n = 19) or SP–AQ and a single dose of primaquine (n = 19). d Sex ratios of gametocytes determined by multiplex or individual qPCR; samples as in c

