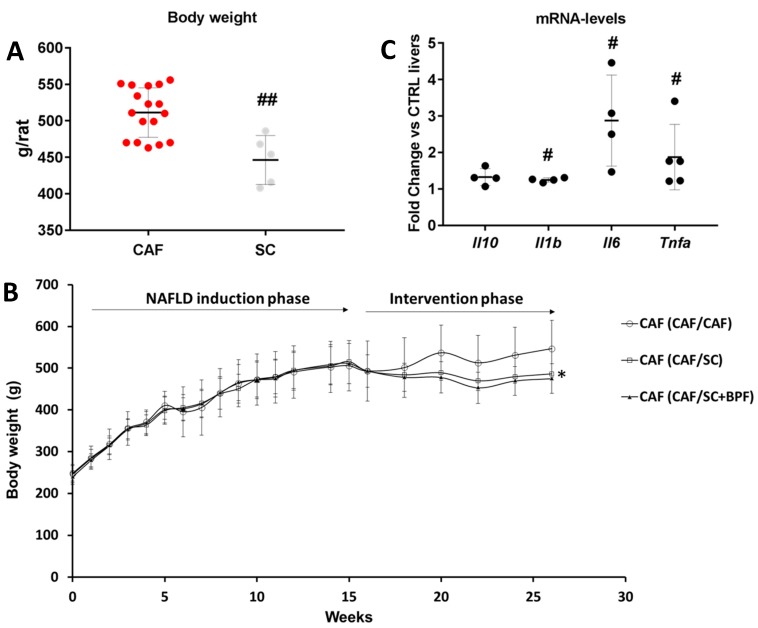
Figure 2.
Starting conditions after the induction phase (16 weeks of CAF diet). (A) Distribution of body weight in rats fed with CAF diet (n = 21) or control SC diet (n = 5) after NAFLD induction phase (16 weeks). ## Statistically significant difference at p ˂ 0.003 when compared to SC control group. (B) Body weight changes over the entire period of the study. Data are represented as means ± SD (n = 7), * p < 0.05 indicates significant differences between CAF/CAF and CAF/SC groups. (C) Significant upregulation of the gene expression of inflammatory cytokines in rat livers at week 15 of CAF diet, before the intervention phase with SC diet. The graph shows the results of cytokine-related mRNA expression profiling performed on 96-well RT2 PCR array plates in three pooled RNA liver samples from three rats. The fold change of relative mRNA levels in CAF livers compared SC and normalized to five HK genes, is presented. Each dot shows the fold change value from one RT2 array plate (three CAF livers vs. SC livers), and the line shows the mean of presented data. Statistical significance at p ≤ 0.02 (#), when compared with control SC livers is reported according to GeneGlobe software (Qiagen), which calculates the p values based on a Student’s t-test of the replicate 2-ΔΔCT values for each gene in the control and treatment groups.

