Figure 6.
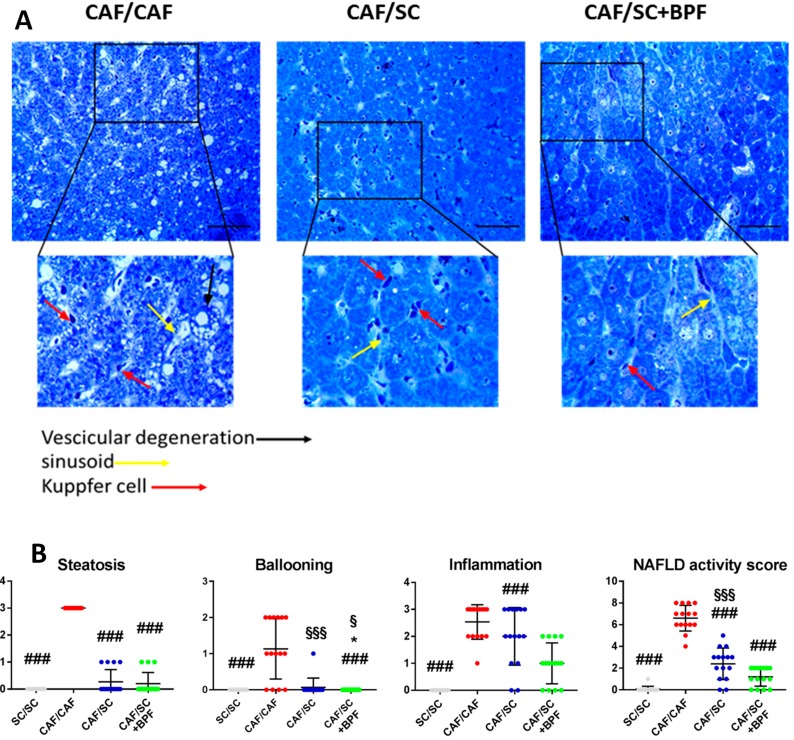
Histological evaluation of NASH. (A) Toluidine-blue staining of representative liver sections from three different treatment groups CAF/CAF (16 + 10 weeks), CAF/SC, and CAF/SC+BPF diet. Scale bar 50 μm. (B) Quantification of NAFLD Activity Score (NAS) parameters such as steatosis, ballooning and inflammation. Data are represented as means ± SD (n = 15 (five animals and three independent sections for each animal)). * p ≤ 0.01 denotes differences statistically significant CAF/SC vs. CAF/SC+BPF; ### p ≤ 0.0007 CAF/CAF vs. SC/SC, CAF/SC, CAF/SC+BPF; § p ≤ 0.01 SC/SC vs. CAF/SC+BPF; §§§ p ≤ 0.01 SC/SC vs. CAF/SC. For statistical analysis, Kruskal-Wallis test was performed.

