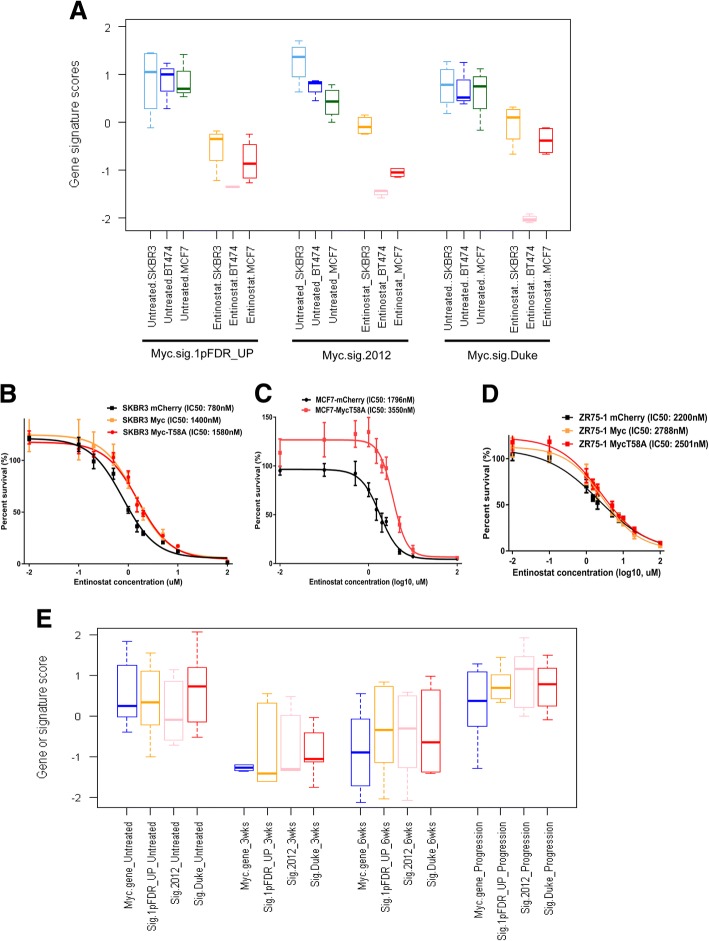
Fig. 3.
Myc signaling controls entinostat sensitivity. a Myc signature analysis of entinostat-treated human breast cancer cell lines. Box and whisker plots for the Myc gene signatures (Myc.sig.1PFDR_UP, Myc.sig.2012, or Myc.sig.DUKE) using the data from SKBR3, BT474, and MCF-7 treated with or without entinostat at their IC50 doses for 72 h. Each colored square represents the relative median transcript abundance (in log2 space) of each signature for untreated SKBR3, BT474, MCF-7 being light blue, blue or light green, or entinostat-treated SKBR3, BT474, MCF-7 being green, pink, or red. b–d Sensitivity to entinostat in luminal breast cancer cell lines with lentiviral Myc constitutive overexpression. After SKBR-3 (b), MCF-7 (c), or ZR75–1 (d) cells were transfected with lentivirus-mediated Myc shRNA, the cells were incubated in various doses of entinostat for 72 h, and then the viability of cells was measured using the MTS assay. Inhibitory concentration (IC) curves are shown with IC50 values in legend. Each point represents the mean ± standard deviation of sextuple determinations. Myc shRNA treatment makes luminal breast cancer cells more resistant toward entinostat as evidenced by an increase in IC50. e Myc gene expression (Myc_gene) or Myc signatures (Sig.1PFDR_UP, Sig.2012, Sig.Duke) in 27 MMTV/Neu luminal mouse model tumors untreated (N = 8) or treated with entinostat at 12 mg/kg for 3 weeks (N = 6), 6 weeks (N = 5), or until progression (N = 8)

