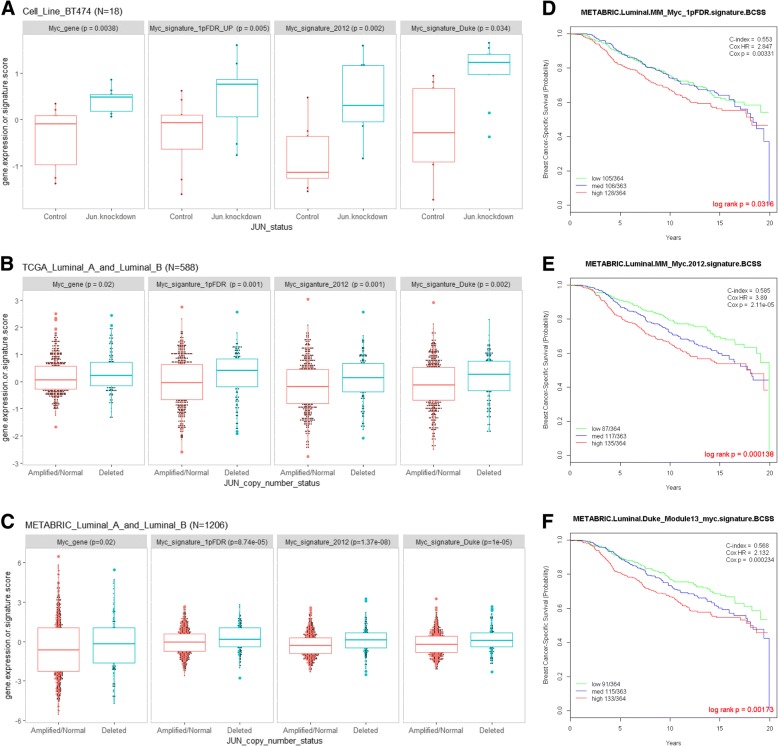
Fig. 5.
Genomic Jun copy number loss correlates Myc signaling activity. a Box and whisker plots are shown as Myc gene expression (Myc.gene) or signature (1PFDR_UP, 2012, DUKE) scores in BT474 with lentiviral c-Jun or scramble shRNA (Control). The middle bar in each square represents standardized, average values. The square represents the interquartile range (25th and 75th percentiles). b Myc gene expression or signature scores in luminal TCGA breast cancer samples with Jun deletion (N = 136) or without Jun deletion (amplified/normal, N = 452). c Myc gene expression or signature scores in luminal METABRIC breast cancer samples Jun deletion (N = 204) or without Jun deletion (amplified/normal, N = 1002). d–f Kaplan-Meier plots on breast cancer-specific survival in 1091 luminal breast cancer patients in METABRIC. Patients with survival of > 20 years were excluded. Patients were classified into three groups with lower, middle, or top third of the scores derived from the Myc signature scores using Myc_1pFDR (d), Myc.2012 (e), or Duke_Module13_myc (f). Two-sided log-rank tests and univariate Cox regression analyses were conducted to determine significance of each Myc signature

