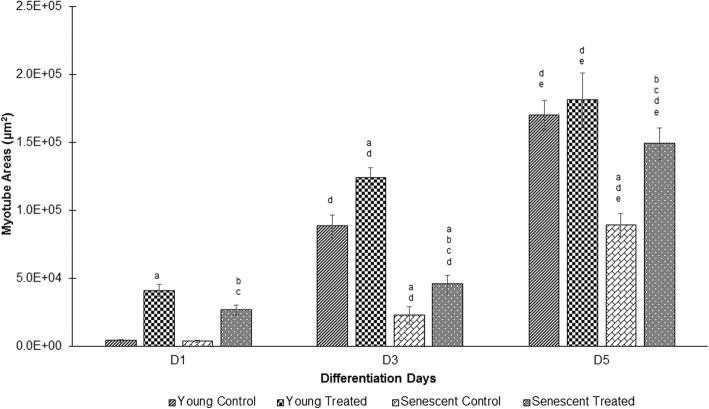
Fig. 3.
Effect of TRF on myoblasts differentiation as measured by myotube surface area. aDenotes p < 0.05 compared to young control, bp < 0.05 compared to senescent control, cp < 0.05 compared to young treated, dp < 0.05 compared to day 1 of the same treatment and ep < 0.05 compared to day 3 of the same treatment. Data are presented as mean ± SD, n = 3

