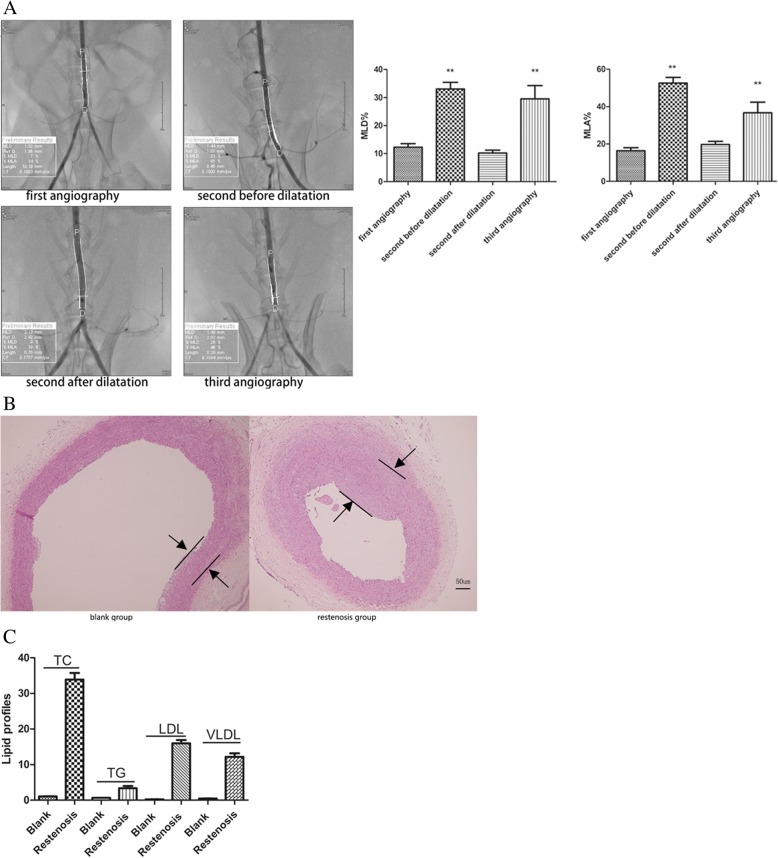
Fig. 1.
The establishment of the restenosis model. (a) Left panels: Angiographic image results in each operation. Right panels: Quantitative analysis of MLD% and MLA% in each operation. **P < 0.01 vs. first angiography. (b) HE staining of aortic tissues from blank group and restenosis group. (c) Quantitative analysis of serum lipid levels blank group and restenosis group

