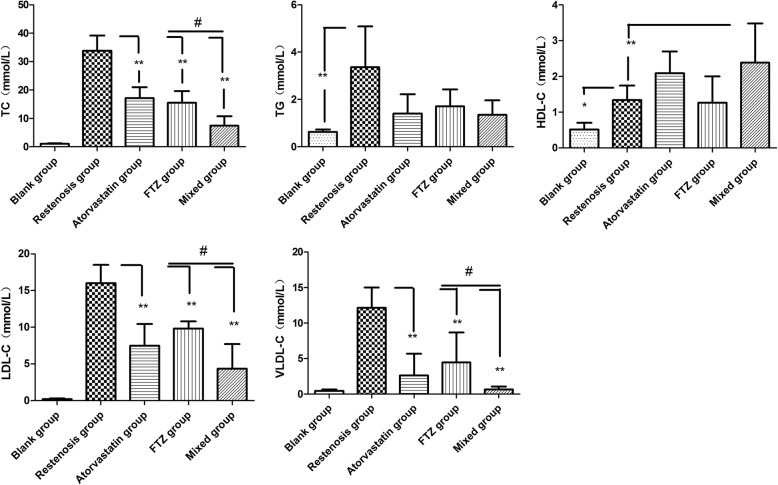
Fig. 2.
Comparison of serum lipid profiles in each experimental group. Compared with the blank group, most of the lipid profiles were significantly increased in the restenosis group, while the increases were attenuated in drug groups. **P < 0.01 vs. restenosis group, *P < 0.05 vs. restenosis group, #P < 0.05 single-used drug group vs. mixed used group

