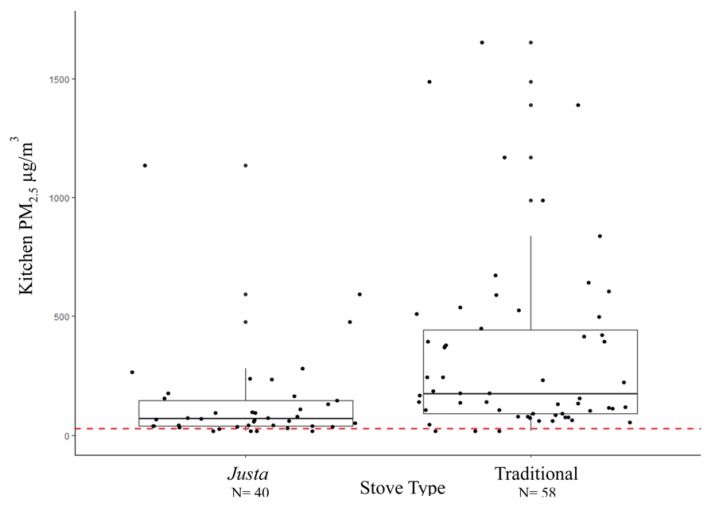
Figure 3.
24-h average kitchen PM2.5 concentrations, Traditional and Justa Stove Users, Rural Honduras (n = 98). PM2.5: fine particulate matter. Top and bottom lines of rectangle represent the 75th and 25th percentiles. The middle line represents the median. The top whisker denotes the value of the 3rd quartile plus 1.5 times the IQR. The bottom whisker denotes the value of the 1st quartile minus 1.5 times the IQR. The red line indicates the World Health Organization (WHO) 24-h guideline of 25 µg/m3.

