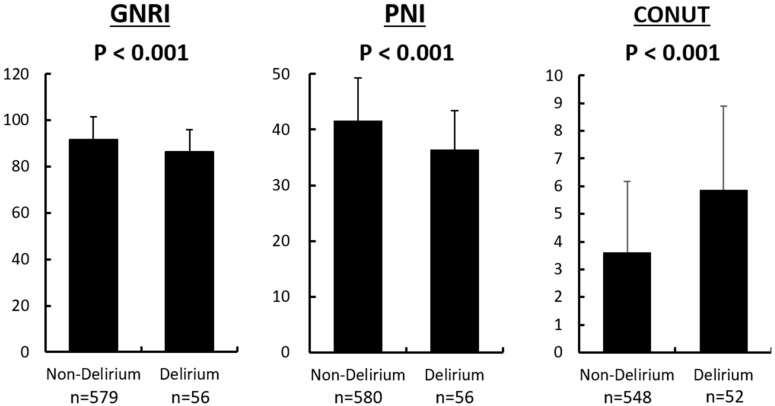
Figure 1.
A comparison of the nutritional indices between the delirium and non-delirium groups. Each nutritional index exhibited a tendency toward malnutrition in the delirium group compared with the non-delirium group. Data are presented as mean ± standard deviation. GNRI, Geriatric Nutritional Risk Index; PNI, Prognostic Nutritional Index; CONUT, Controlling Nutritional Status.

