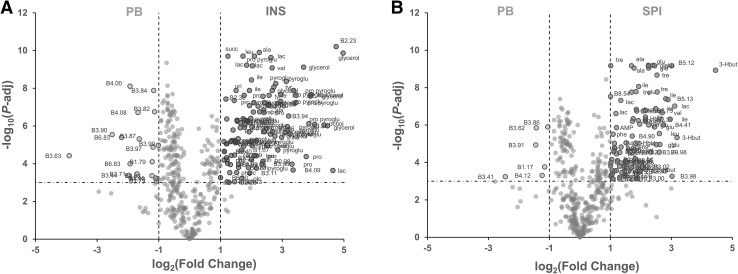
Fig. 2.
Volcano plot analysis of INS or SPI alternative feeds compared to PB feed for 473 spectral bins measured in feeds using 1H NMR profiling of polar extracts. Details with all variable names, annotations, ratios and P-values are presented in Online Resources 3 and 4. a Volcano plot analysis of PB and INS feeds with Wilcoxon’s test. Non-annotated dots correspond to metabolite features with adjusted P > 0.001 or 0.5 < INS/PB ratio < 2. All features with adjusted P < 0.001 and INS/PB ratio < 0.5 or > 2 are annotated. All identified compounds corresponding to these bins are annotated. b Volcano plot analysis of PB and SPI feeds with Wilcoxon’s test. Non-annotated dots correspond to metabolite features with adjusted P > 0.001 or 0.5 < SPI/PB ratio < 2. All features with adjusted P < 0.001 and SPI/PB ratio < 0.5 or > 2 are annotated. All identified compounds corresponding to these features are annotated. 3-Hbut 3-hydroxybutyrate, AMP adenosine mono-phosphate, ala alanine, carn carnitine, eth ethanolamine, glc glucose, glu glutamate, hypox hypoxanthine, ile isoleucine, lac lactate, leu leucine, orn ornithine, phe phenylalanine, pchol phosphocholine, pro proline, pyroglu pyroglutamate, succ succinate, tyr tyrosine, uri uridine, val valine

