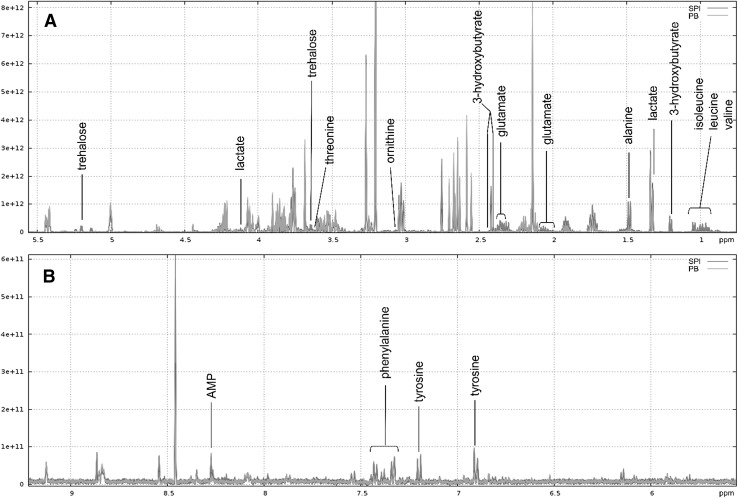
Fig. 4.
Superimposition of one representative 1H NMR CPMG spectrum of a polar extract for SPI and one for PB feed. a Spectral region δ 0.75–5.5 ppm. b spectral region δ 5.5–9.2 ppm. Annotated compounds correspond to variables highlighted in volcano plots with fold change > 2 and P-adj < 0.001. Spectrum of PB feed extract in green and that of SPI in red

