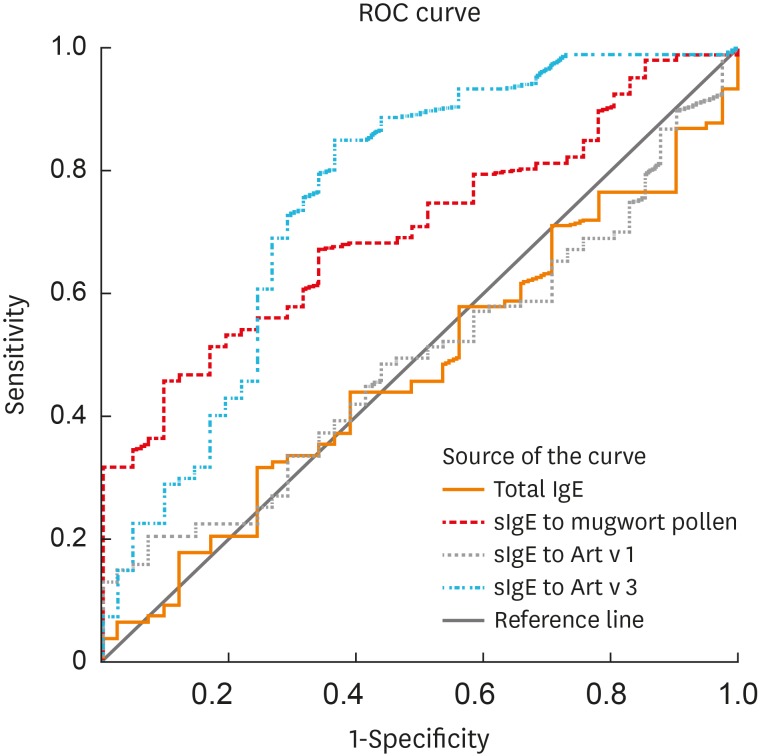
Fig. 3. Comparison of levels of total IgE and specific IgE to mugwort pollen, Art v 1 and Art v 3 in predicting mugwort pollen-related food allergy. Art v 3-specific IgE had the largest area under ROC curve (AUC, 0.757; 95% CI, 0.662–0.852; P < 0.001) with reference to total IgE (AUC, 0.479; 95% CI, 0.379–0.578; P = 0.689), specific IgE to mugwort pollen (AUC, 0.705; 95% CI, 0.620–0.789; P < 0.001) and Art v 1 (AUC, 0.495; 95% CI, 0.397–0.593; P = 0.925).
IgE, immunoglobulin E; ROC, receiver operating characteristic; AUC, area under the curve; CI, confidence interval.

