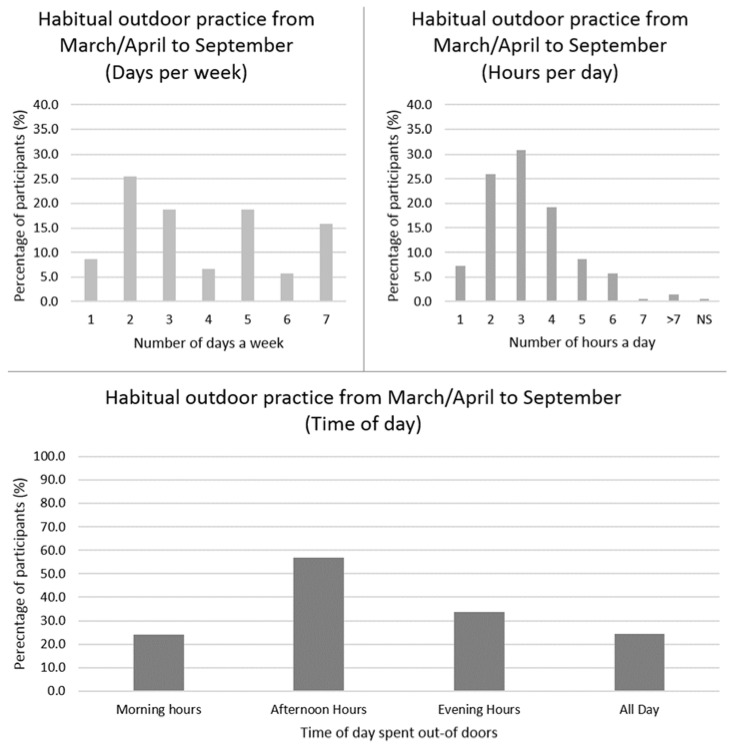
Figure 3.
UK participants’ frequency of time spent outdoors in daylight from March/April to September (n = 208, one participant did not respond). Top left: Habitual number of days per week spent outdoors. Top right: Habitual number of hours per day spent outdoors. Bottom: Habitual time of day spent outdoors, not indicative of one single day; participants were able to select all relevant answers. Abbreviations: Not Specified (NS); Percentage (%).

