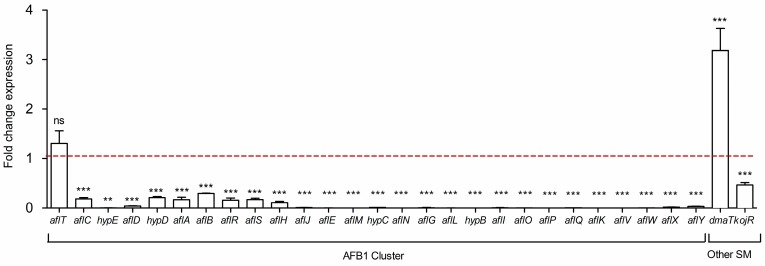
Figure 2.
Fold change in the expression of genes belonging to the aflatoxin B1 (AFB1), cyclopiazonic acid and kojic acid biosynthetic pathways. The dotted baseline represents the control expression level; ns = no significant change; * p-value < 0.05; ** p-value < 0.01; *** p-value < 0.001. SM = secondary metabolite.

