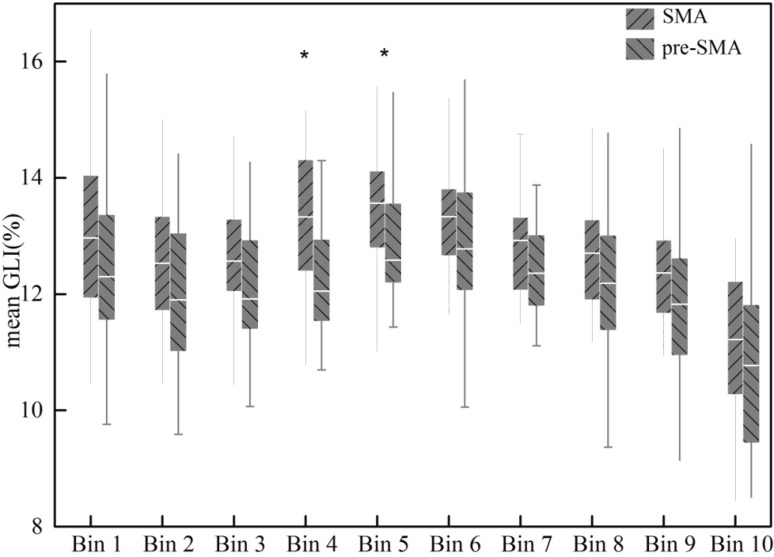
Fig. 5.
Box plots of the 10%-interval bins (x axis) into which the mean profiles (grey-level index, GLI, %, y axis) of areas SMA and pre-SMA were divided for statistical analysis. Bin 1, Bin 2,…Bin 10 indicate the bin from the border between layers I and II (Bin 1) to the border between layer VI and the white matter (Bin 10). Center horizontal indicated the mean GLI values of each bin in each area. *Bins 4 and bins 5 in the two groups showed significant differences (p < 0.05, pairwise comparison)

