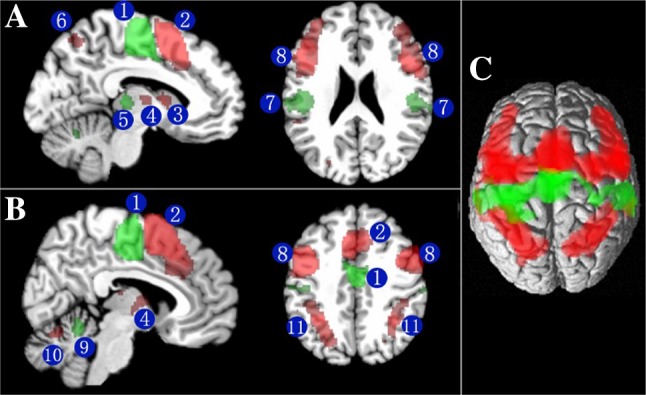
Fig. 8.

Contrast analysis of significant co-activation clusters for areas SMA and pre-SMA overlaid on the single-subject MNI template brain. The green colored regions are significantly stronger co-activated with area SMA. The red colored regions are significantly stronger co-activated with area pre-SMA. a, b Section through the MNI template showing the significant stronger co-activation clusters for area SMA and pre-SMA. Arabic numerals indicate the cluster locations with cytoarchitectonic informed anatomical labeling: 1 SMA; 2 pre-SMA; 3 caudate; 4 thalamus; 5 putamen; 6 superior parietal lobule; 7 superamarginal gyrus; 8 inferior frontal gyrus; 9 cerebellar Vemis; 10 cerebellums(VI); 11 inferior parietal lobule. c 3D rendering of the contrast of significant co-activation clusters for areas SMA and pre-SMA in MNI space. The anatomical localization of imaging results was determined by means of the SPM Anatomy Toolbox (Eickhoff et al. 2007)
