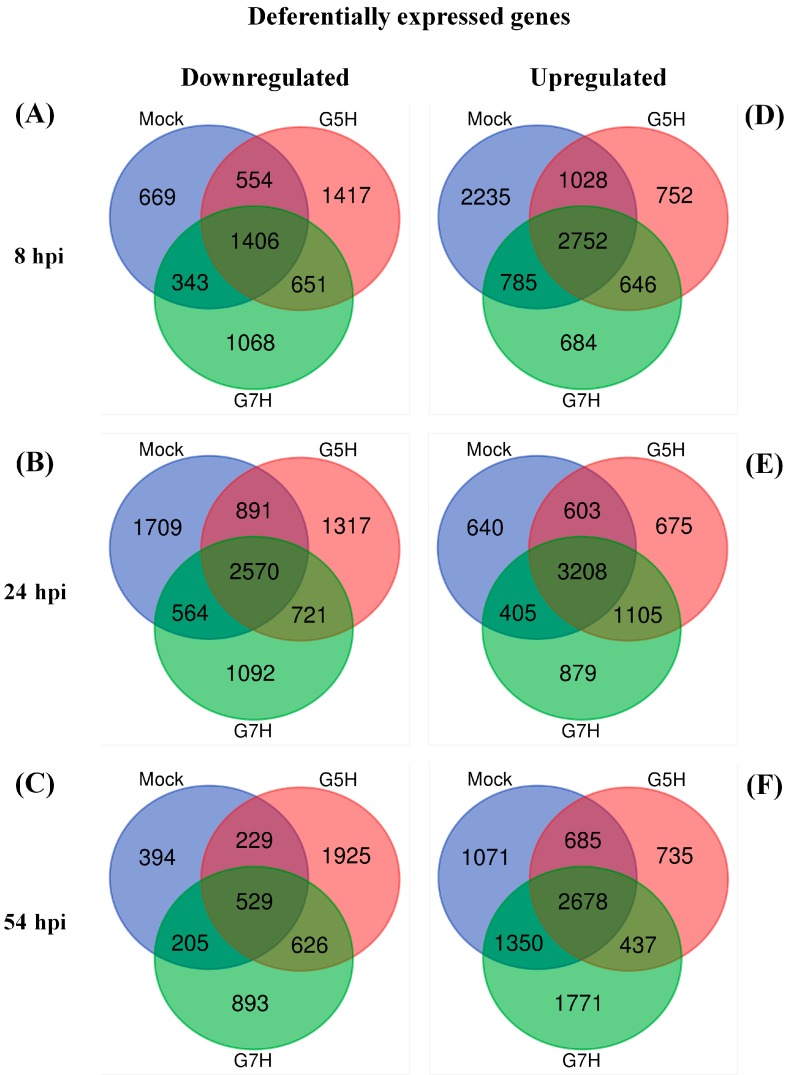
Figure 1.
Venn diagrams illustrating the clustering of the differentially expressed genes (DEGs). The diagrams show up- and downregulated DEGs from soybean plants (cultivar L29 carrying the Rsv3 ER gene) that were mock inoculated, infected with SMV avirulent G5H, or infected with SMV virulent G7H. DEGs were subjected to calculation of intersection using Venn diagrams: Downregulated DEGs at 8 hpi (A), 24 hpi (B), and 54 hpi (C). Upregulated DEGs at 8 hpi (D), 24 hpi (E), and 54 hpi (F). DEG lists were obtained from RNA-seq data using EXPath Tool by comparing the expression levels of healthy plants to those in mock plants and G5H- and G7H-infected plants at different time points.

