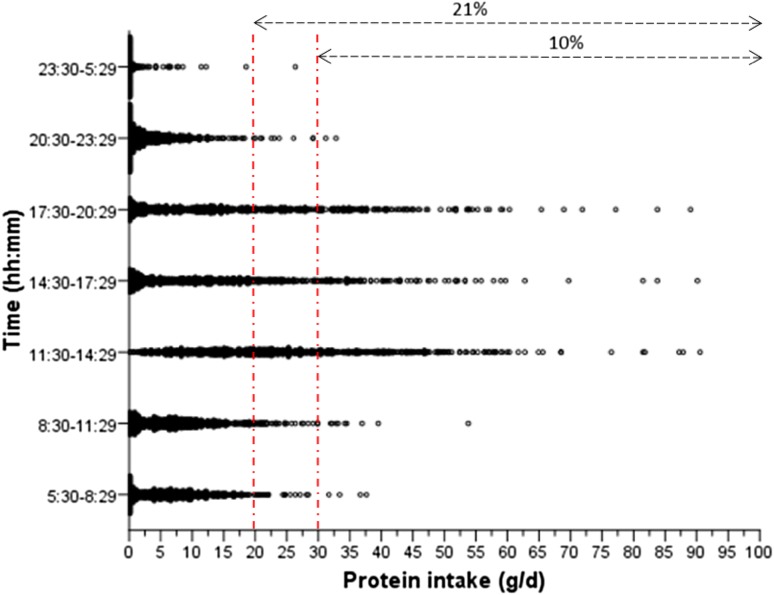
Fig. 1.
Protein intake (g/day) distribution per time category (meal) for individual participants (n = 722) in the Newcastle 85+ Study. The vertical-dashed lines represent the suggested protein amount of either 20 g/meal or 30 g/meal believed to be necessary for optimal protein synthesis. The arrows represent the % of all meals by all participants that meet that threshold. 75% (n = 542) of participants had a meal between 5:30 and 8:29, 89% (n = 643) from 8:30 to 11:29, 99% (n = 714) from 11:30 to 14:29, 90% (n = 646) from 14:30 to 17:29, 86% (n = 623) from 17:30 to 20:29, 73% (n = 112) from 20:30 to 23:29 and 16% (n = 112) from 23:30 to 5:29

