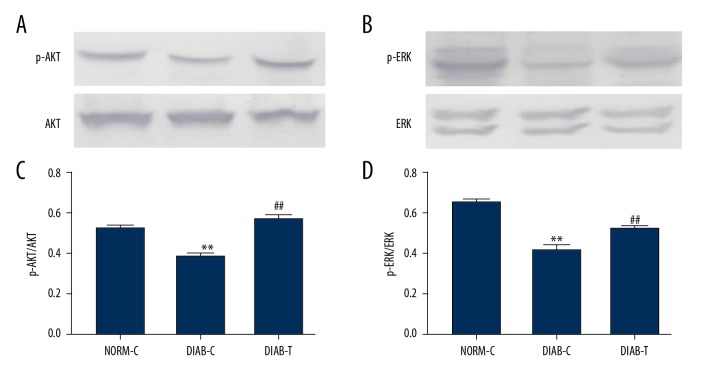
Figure 6.
Effect of fusion protein on p-Akt and p-ERK1/2 expression. (A) Expression of p-AKT; (B) relative levels of p-AKT; (C) expression of p-ERK 1/2; and (D) relative levels of p-ERK 1/2. Results were expressed as mean ± standard error of the mean of the values. The number of animals per group was 6 for expression of p-AKT, and p-ERK 1/2. ** P<0.01 versus NORM-C; ## P<0.01 versus DIAB-C.

