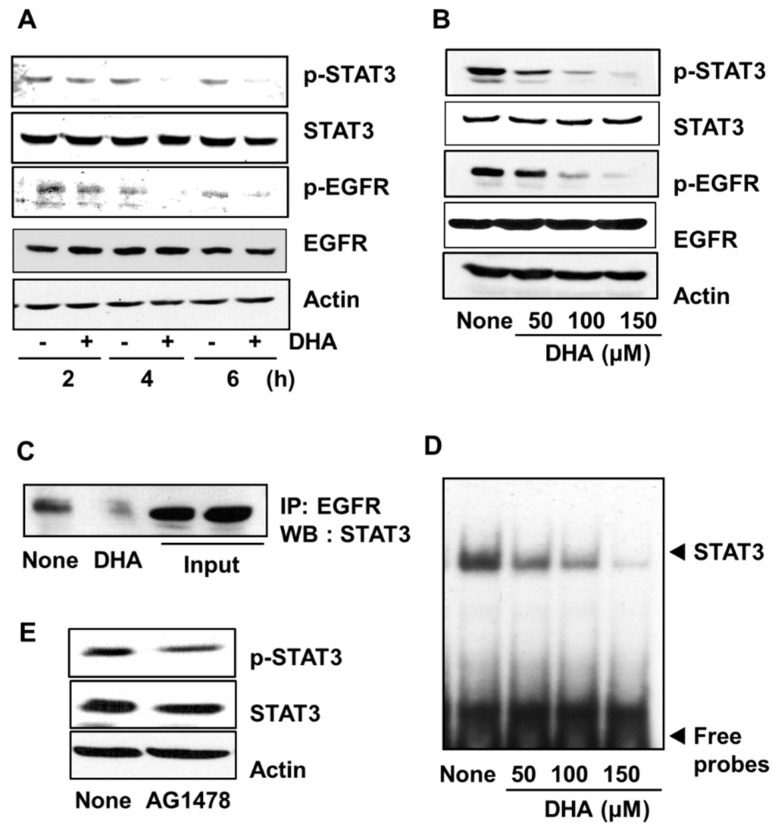
Figure 3.
Effect of DHA on the levels of phospho (p)-STAT3, STAT3, p-EGFR, and EGFR, the interaction of EGFR and STAT3, STAT3 DNA-binding activity, and the effect of AG1478 on p-STAT3 and STAT3 levels in PANC-1 cells. Cells were treated with 150 µM DHA for various time periods (A) and with 50, 100, and 150 µM DHA for 4 h (B–D). The cells were treated with 10 μM tyrophostin AG1478 for 4 h (E). (A) Plot of the protein levels of p-STAT3, STAT3, p-EGFR, and EGFR (and the protein standard actin) in the cells treated with 150 µM DHA for 2, 4, and 6 h. “-” means without DHA treatment and “+” represents with DHA treatment. (B) Plot of the protein levels of p-STAT3, STAT3, p-EGFR, and EGFR (and the protein standard actin) in the cells treated for 4 h with the concentrations of DHA indicated. Column “None” corresponds to the extract from untreated cells, column “50”, “100”, and “150” to the extracts from cells treated with 50, 100, and 150 µM DHA, respectively. (C) Western blot (WB) of PANC-1 cells treated with 150 µM DHA for 4 h. The total cell lysates were immunoprecipitated (IP) with EGFR antibody and then immunoblotted (by Western blotting, WB) using STAT3 antibody. (D) DNA-binding activity of STAT3 in PANC-1 cells treated for 4 h with the indicated concentrations of DHA. The description of the columns is the same as in (B). (E) Plot of the protein levels of p-STAT3 and STAT3 (and the protein standard actin) in the cells treated with 10 µM AG1478 for 4 h. The column labeled “None” corresponds to the extracts from untreated cells and the column labeled “AG1478” corresponds to the extracts from cells treated with 10 µM AG1478. EGFR = epidermal growth factor receptor (EGFR); STAT3 = signal transducer and activator of transcription factor 3.

