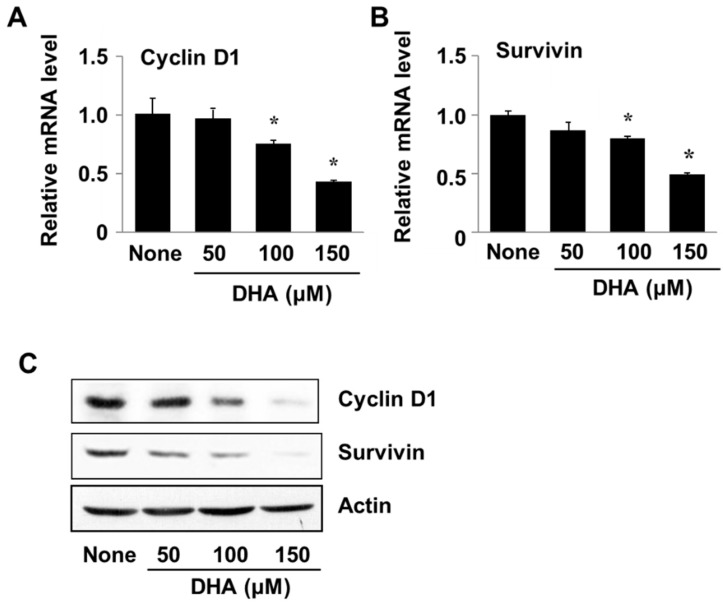
Figure 5.
The effect of DHA on cyclin D1 and survivin gene expression in PANC-1 cells. Cells were treated with DHA for 24 h. (A,B) A plot of the relative levels of cyclin D and survivin messenger RNA (mRNA), determined by using real-time PCR analysis. * p < 0.05 vs. None. Column “None” corresponds to the untreated cell extract, column “50”, “100”, and “150”to the extracts of cells treated with 50, 100, and 150 µM DHA, respectively. (C) Western blot detection of cyclin D and survivin. The description of the columns is the same as in (A,B).

