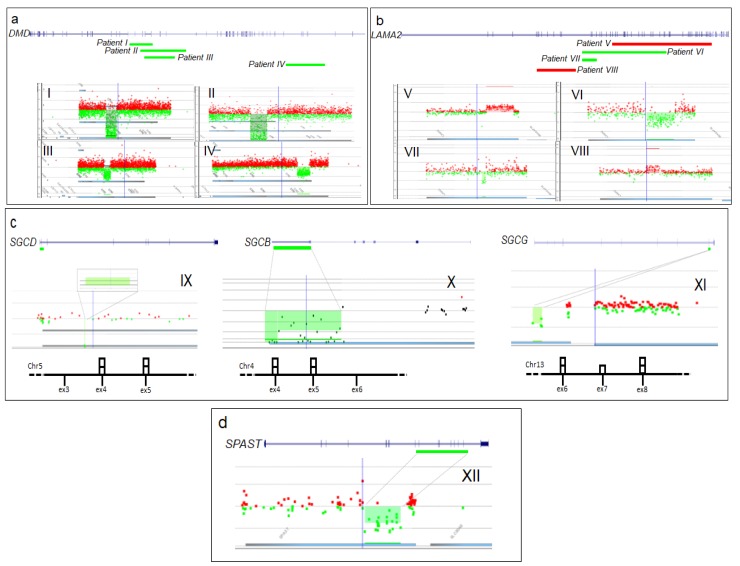
Figure 1.
Graphic view of 12 causative copy number variants (CNVs). Gene representation and array CGH panels showing: (a) 4 DMD deletions (patients I–IV); (b) 2 deletions and 2 duplications in LAMA2 (patients V–VIII); (c) 3 deletions involving sarcoglycan genes (patients IX–XI); (d) SPAST gene deletion in patient XII. Green bars indicate deletions and red bars indicate duplications. The results of genomic quantification by real-time PCR are schematically represented (bottom of c). The number of each coding exon along gene is surmounted by a square corresponding to the number of detected copies.

