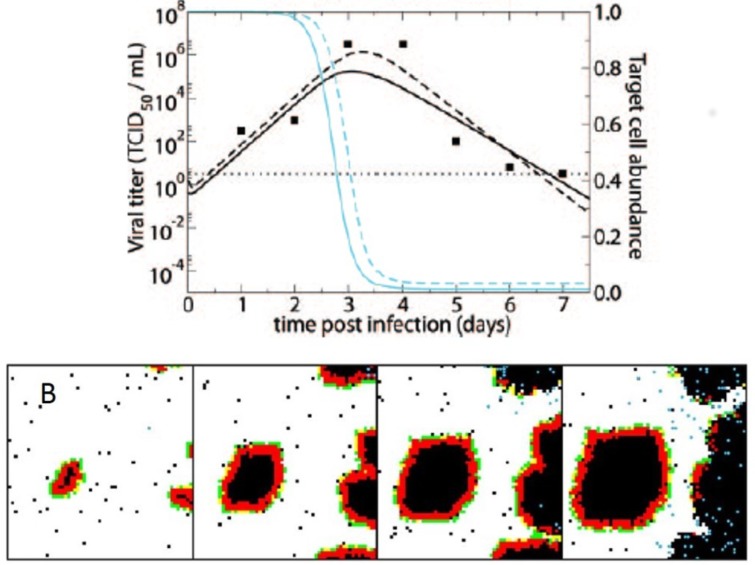
Figure 2.
(A) Fit of a non-spatial, target-cell-limited within-host influenza model to viral load data from a human subject experimentally infected with influenza A subtype H1N1. The data are shown as black points. The black lines show model fits of viral load data. The blue lines show model-predicted declines in the number of target cells. Solid lines show the fits of the basic model; dashed lines show the fits of a more complex model with an eclipse phase before infected cells produce virus. Figure is reproduced from [60]; (B) Cellular automata model of within-host influenza infection under assumptions of local cell regeneration and localized recruitment of immune cells. Panels, from left to right, show the time evolution of the cellular automata model. Simulations reproduce the appearance of infected foci. Figure reproduced from [67].

