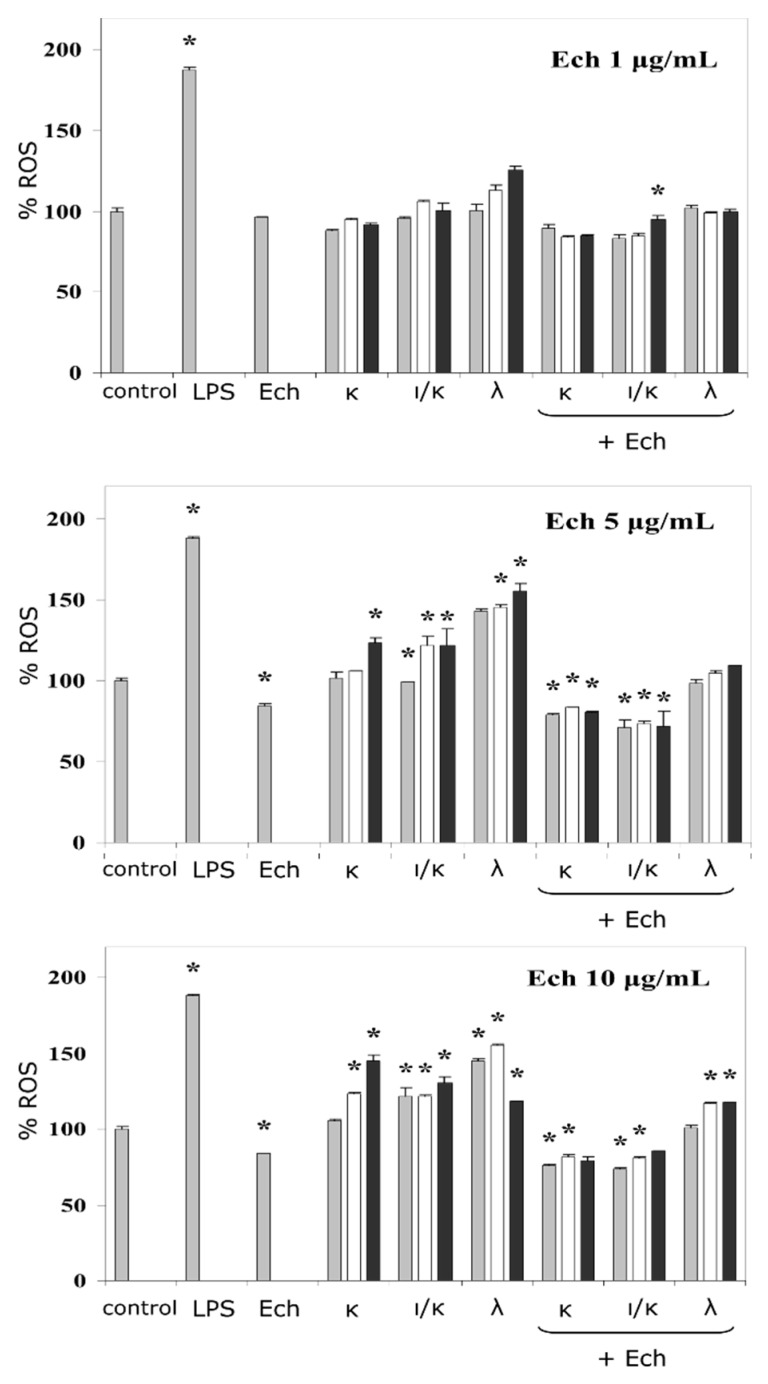
Figure 2.
Neutrophils reactive oxygen species (ROS) formation in the presence of the Ech, CRGs, and their complexes. The concentration of the lipopolysaccharide (LPS) was 10 μg mL−1 and of the Ech was 1.0, 5.0, or 10.0 μg mL−1, final value. The concentrations of the CRGs alone and in complexes with the Ech changed in the following ratios row:  = 5:1;
  = 10:1;
  = 20:1. The results are expressed as % change in ROS, relative to the control (100%), * p < 0.05.

