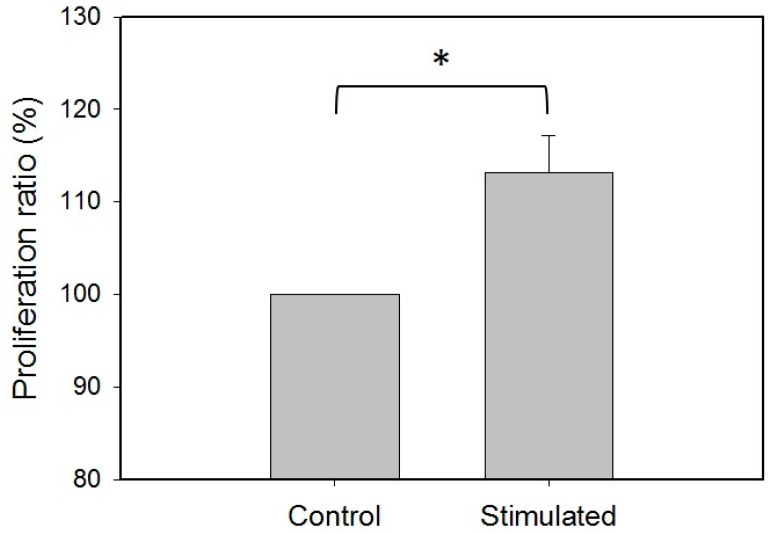
Figure 7.
Investigation of the cell proliferation after the stimulation of the multi-axial tensile strain for three days. The control group represents the cells that were cultured without tensile strain. The stimulated group represents the cells were cultured with tensile strain. The ADSCs were isolated from the tissue samples of patients #1 and #2. The data were generated from three repeated experiments for each tissue sample. The data are presented as mean ± standard error. The results were analyzed using one-way analysis of variance (ANOVA). Statistical significance is indicated as * for p < 0.05.

