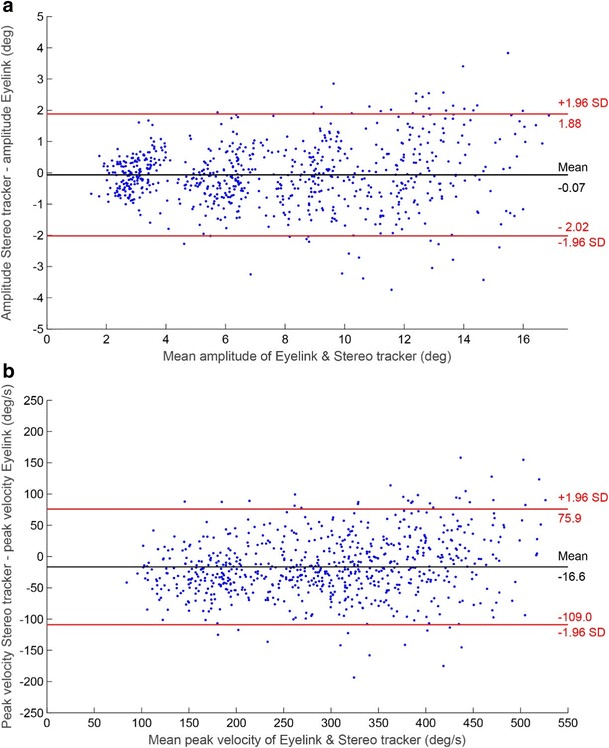
Fig. 12.

Bland–Altman plots showing the trial-to-trial differences between the stereo eyetracker and the EyeLink, with 95% confidence intervals, for (A) the saccade amplitude and (B) the peak velocity of the saccades. The data are from the central head position, pooled across eyes and participants
