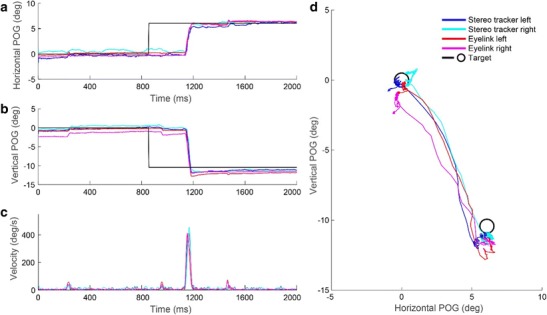
Fig. 6.

Simultaneous records of both eyetracking systems during one trial. (A) Horizontal POG estimations as a function of time. (B) Vertical POG estimations as a function of time. (C) The corresponding vectorial eye velocity traces, calculated after applying a Butterworth filter (8th-order, cutoff 40 Hz) to the position data. (D) 2-D trajectories of the POG estimations. The results for both eyes are shown. The target positions are plotted as black circles
