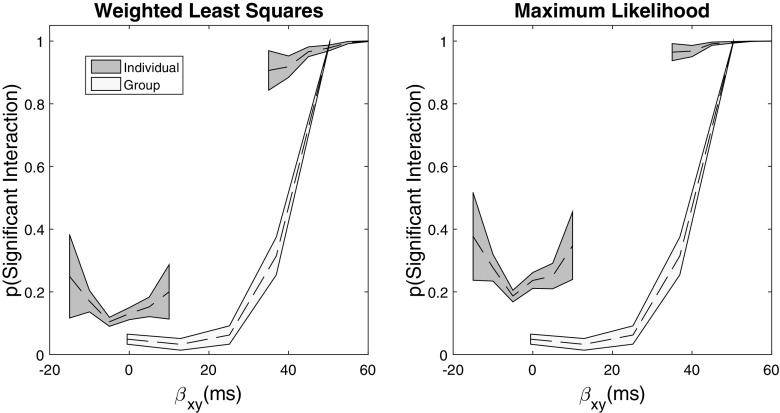
Fig. 1.
Simulated results for N = 4 participants. The dotted line shows the average power estimate, and the shaded region is the bootstrapped 95% confidence intervals for each analysis. The x-axis is the magnitude of the interaction parameter in the generating model (Equation A4); the y-axis is the proportion of times in which a significant interaction was identified in the simulations

