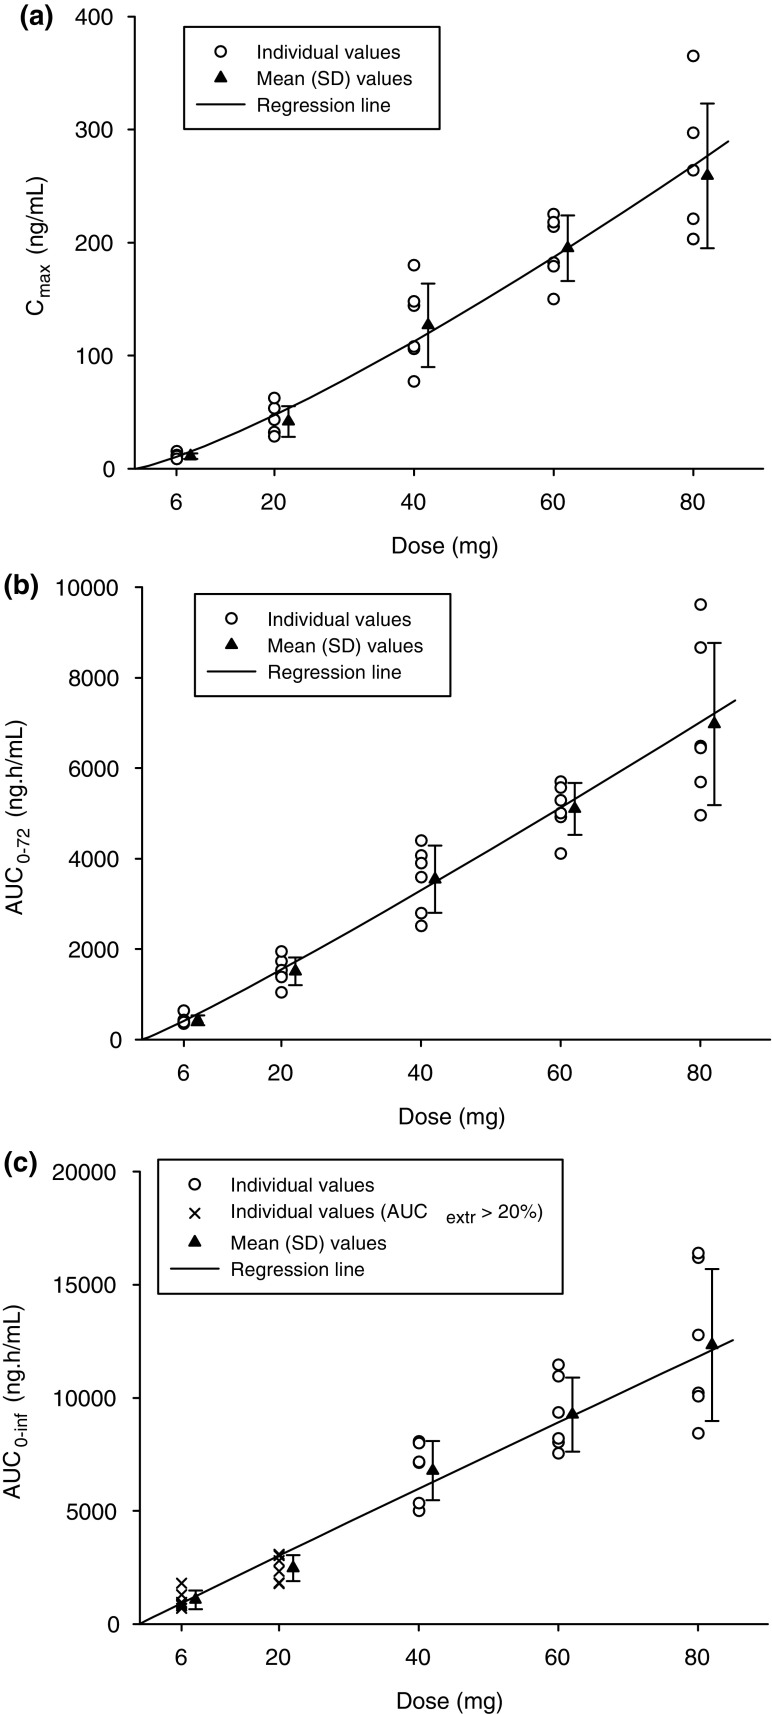
Fig. 3.
Mean (± SD) baloxavir acid a Cmax, b AUC72, and c AUC∞ by baloxavir marboxil dose in the fasted stated (Study 1). AUC72 area under the concentration-time curve from time zero to 72 h, AUC∞ area under the concentration-time curve from time zero to infinity, AUCextr the extrapolated percentage of AUC∞, Cmax maximum plasma concentration

