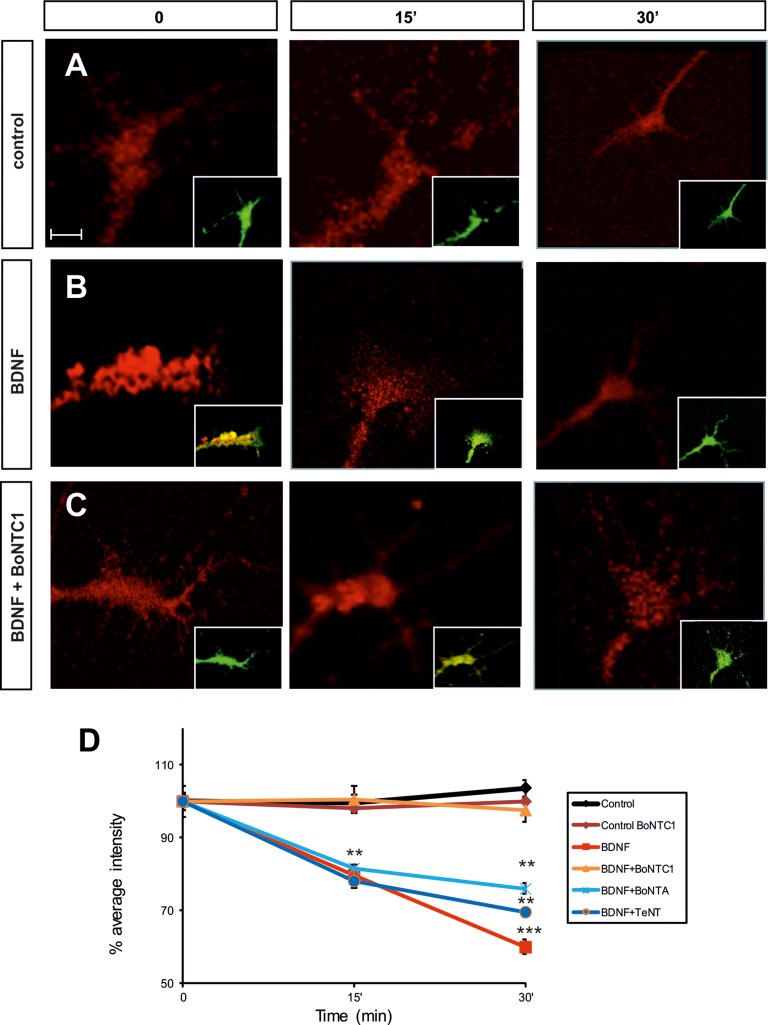
Figure 8. Fluorescence micrographs of the Nodose explant axonal growth cones.
Neurons were labeled with Bodipy-ceramide. Growth cones were challenged with control medium (A), BDNF (B), after factor deprivation, or BDNF+BoNT/C1 (C), for the time indicated in minutes. Percentage of average intensity of red fluorescent puncta in growth cones for control, BDNF-, BoNT/C1-, BoNT/A- and TeNT-treated Nodose neurons (normalized to 100% at the onset of treatment) (D). Data points are means ± s.e.m. from eighty growth cones quantified from an average of eighteen explants per condition taken from six embryos in three separate experiments. Significant differences are labeled by asterisks (**p ≤ 0.01; ***p ≤ 0.001). Scale bar: A, 2 μm. Error bars indicate SEM.

