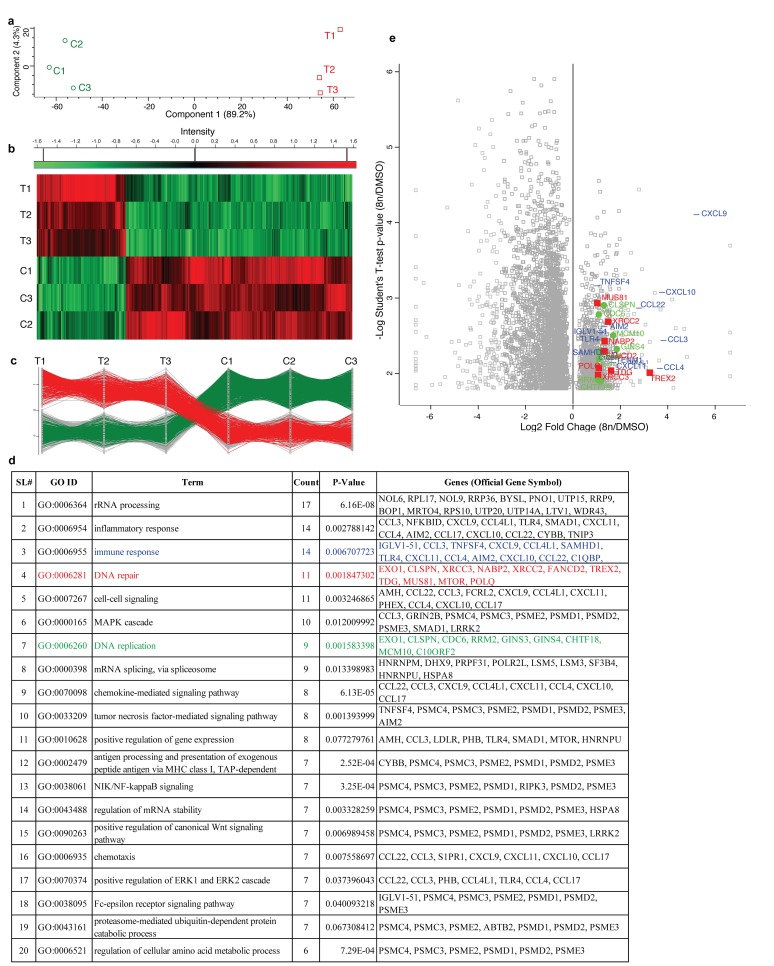
Figure 3. RNA sequencing of DIAP cells shows up-regulation of genes involved in DNA repair, DNA replication and immune response.
(a) PCA (Principal component analysis) of control vs treated (8n) biological replicates. (b) Gene expression heat map showed that 1,234 genes were up-regulated, and 3,186 genes were down-regulated in all three biologic replicates in treatments vs. controls. (c) Profile plot showed that 404 up-regulated and 605 down-regulated genes follow the same pattern across treatment vs control in all biological replicates. (d) DAVID database search with up-regulated genes identify GO terms associated with DNA repair, DNA replication, immune response along with others. (e) Log2 fold change vs -log10 P-value visualization of genes associated with DNA repairs (red), DNA replication (green) and immune response (blue). All right most (same vertical line) genes were identified only in 8n-cells but not in DMSO control. On the other hand, all left most (same vertical line) genes were identified only in the DMSO control but absent in 8n-cells.

