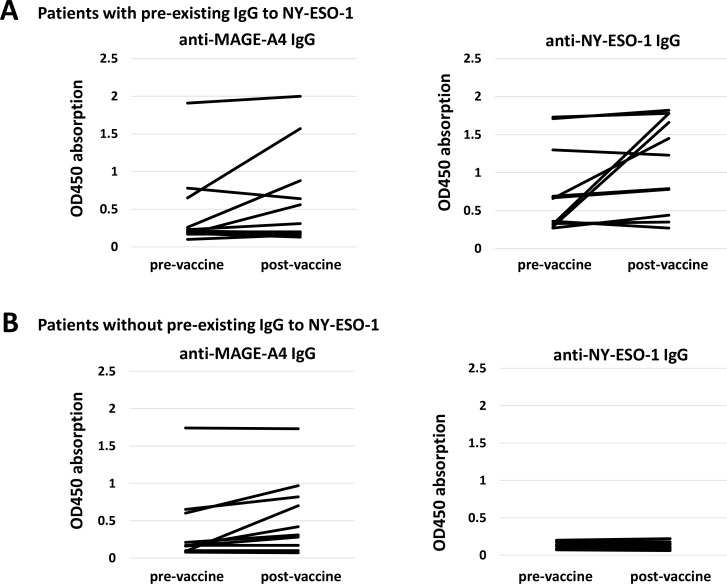
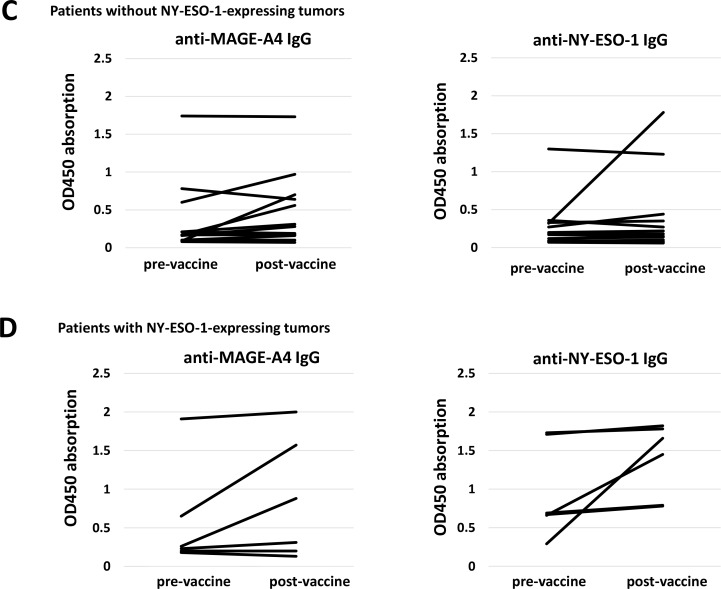
Figure 3. Antibody responses after CHP-MAGE-A4 vaccinations.
(A) Left panel shows IgG responses measured by ELISA assay to MAGE-A4 protein in patients who had pre-existing IgG to NY-ESO-1 antigen (n = 11). Right panel shows IgG responses to NY-ESO-1 protein in the same patients. (B) Left panel shows IgG responses measured by ELISA assay to MAGE-A4 protein in patients who did not have pre-existing IgG to NY-ESO-1 antigen (n = 10). Right panel shows IgG responses to NY-ESO-1 protein in the same patients. (C) Left panel shows IgG responses to MAGE-A4 protein in patients whose tumors did not express NY-ESO-1 antigen (n = 13). Right panel shows IgG responses to NY-ESO-1 protein in the same patients. (D) Left panel shows IgG responses to MAGE-A4 protein in patients whose tumors expressed NY-ESO-1 antigen (n = 6). Right panel shows IgG responses to NY-ESO-1 protein in the same patients.


