Fig. 4.
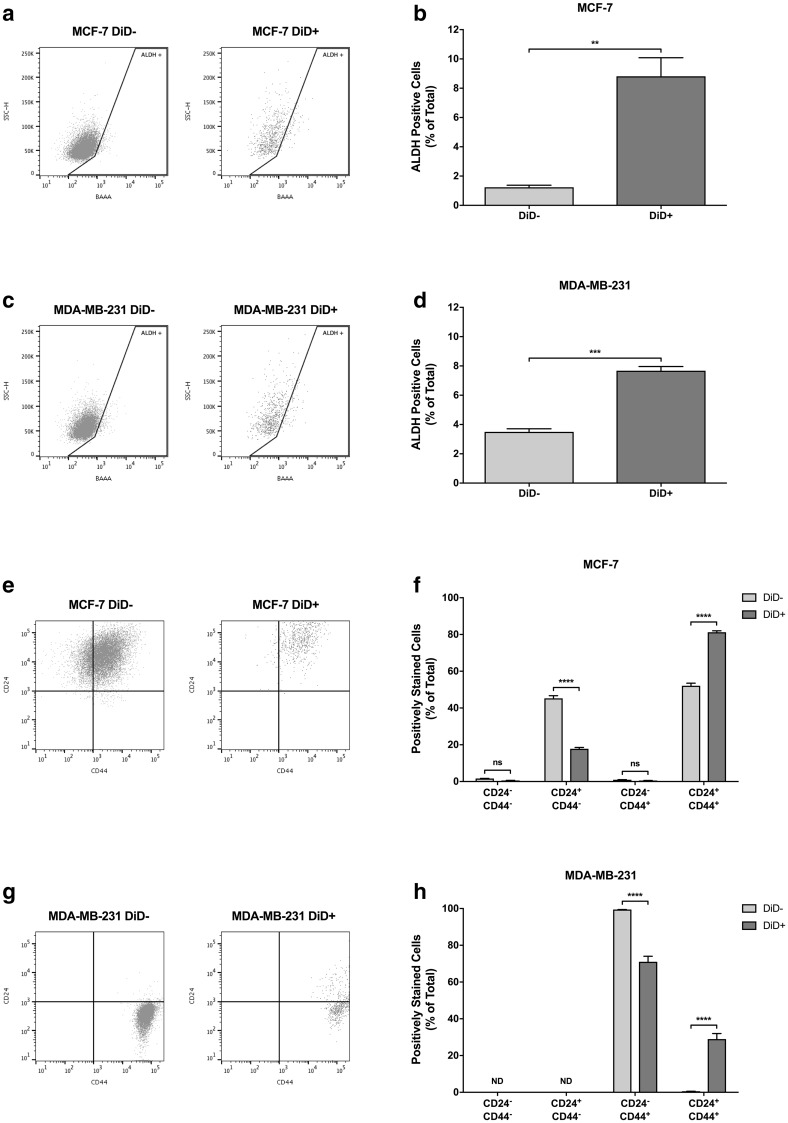
Label-retaining cells differentially express cancer stem cell markers. a Representative flow cytometry plots depicting aldehyde dehydrogenase (ALDH) activity in DiD− and DiD+ MCF-7 sub-populations. b Relative expression of ALDH by DiD− and DiD+ MCF-7 cells (n = 3, unpaired t-test, ** = P ≤ 0.01). c Representative flow cytometry plots depicting ALDH activity in DiD− and DiD+ MDA-MB-231 sub-populations. d Relative expression of ALDH by DiD− and DiD+ MDA-MB-231 cells (n = 3, unpaired t-test, *** = P ≤ 0.001). e Representative flow cytometry plots depicting CD24 and CD44 expression status of DiD− and DiD+ MCF-7 sub-populations. f Relative expression of CD24 and CD44 by DiD− and DiD+ MCF-7 cells (n = 3, two-way ANOVA with Sidak’s multiple comparison, ns = P > 0.05, **** = P ≤ 0.0001). g Representative flow cytometry plots depicting CD24 and CD44 expression status of Vybrant® DiD− and DiD+ MDA-MB-231 sub-populations. h Relative expression of CD24 and CD44 by DiD− and DiD+ MDA-MB-231 cells (n = 3, two-way ANOVA with Sidak’s multiple comparison, ND = not detected, **** = P ≤ 0.0001). All graphical data are expressed as mean ± SEM

