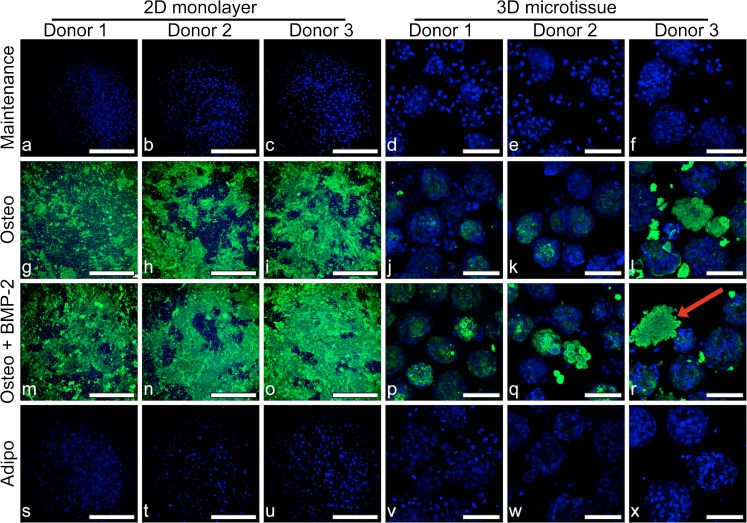
Fig. 6.
Fluorescence microscopy of 2D cultures for BMSC donor 1 (a, g, m and s), donor 2 (b, h, n and t) and donor 3 (c, i, o and u) and in 3D cultures for BMSC donor 1 (d, j, p and v), donor 2 (e, k, q and w) and donor 3 (f, l, r and x) at day 21. BMSC were cultured in maintenance medium (DMEM + 10% FBS) (a–f), osteogenic medium (Osteo) (g–l), osteogenic medium + BMP-2 (Osteo + BMP-2) (m–r) or adipogenic medium (Adipo) (s–x). Hydroxyapatite deposition was evaluated by staining with OsteoImage (green) and nuclei are stained with DAPI (blue). The red arrow in (r) points to an example of mineralised matrix from a 3D microtissue culture with fragmented nuclear staining. 2D monolayer scale bars = 500 μm and 3D microtissue scale bars = 100 μm

