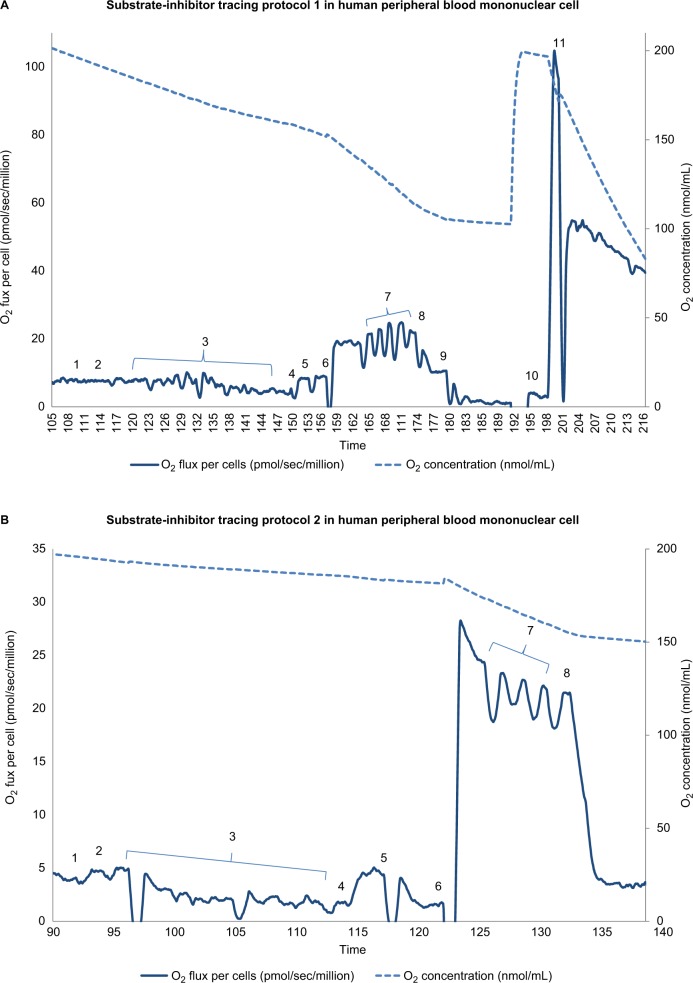
Figure 1.
Substrate-inhibitor tracing of protocols 1 and 2 in peripheral blood mononuclear cells.
Notes: (A) The oxygen consumption rate is plotted on the left y axis and the oxygen concentration curve is plotted on the right y axis. A total of 11 additions of reagents and inhibitors are tagged with a numeric symbol. Eleven additions of reagents and inhibitors are tagged with a numeric symbol. 1=2 mM malate; 2=2.5 mM pyruvate; 3=20 μg/mL digitonin; 4=2.5 mM ADP (adenosine diphosphate); 5=10 mM glutamate; 6=10 mM succinate; 7=0.25 μM increment of FCCP (carbonylcyanide-p-trifluoromethoxy phenylhydrazone); 8=150 nM rotenone; 9=125 nM antimycin A; 10=1 mM TMPD (tetramethyl-p-phenylenediamine)+2 mM ascorbate; 11=200 mM sodium azide. (B) The oxygen consumption rate is plotted on the left y axis and the oxygen concentration curve is plotted on the right y axis. Eight additions of reagents and inhibitors are tagged with a numeric symbol. 1=2 mM malate; 2=10 μM palmitoylcarnitine; 3=20 μg/mL digitonin; 4=2.5 mM ADP (adenosine diphosphate); 5=150 nM rotenone; 6=0.5 mM DHQ (duroquinol); 7=0.25 μM increment of FCCP (carbonylcyanide-p-trifluoromethoxyphenylhydrazone); 8=125 nM antimycin A.

