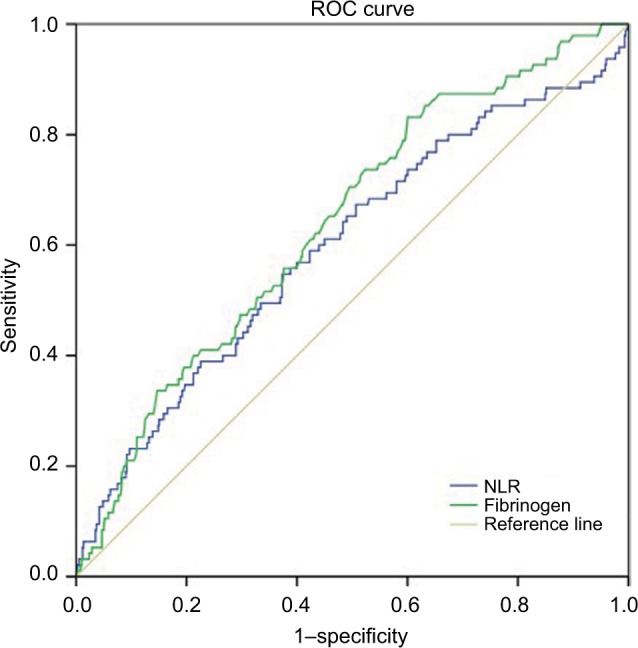
Figure 1.

ROC curves to assess the predictive value of plasma fibrinogen and NLR.
Notes: The cutoff values were 2.34 for NLR and 2.97 g/L for fibrinogen (sensitivity and specificity: 54.7% and 62.7% for NLR, 82.3% and 40% for fibrinogen, respectively).
Abbreviations: NLR, neutrophil–lymphocyte ratio; F-NLR, combined fibrinogen and NLR; ROC, receiver operating characteristic.
