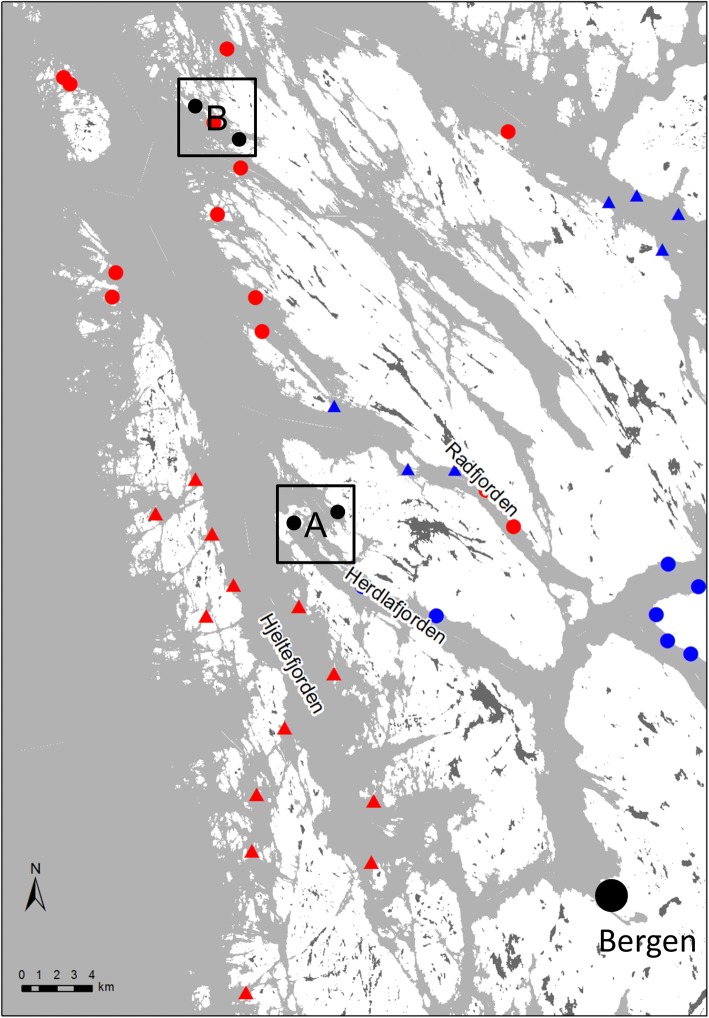
Fig. 1.
Map of the sampling area. The locations of the city of Bergen and the fish farms are indicated on the map (A, Area A; B, Area B). The different colours and shapes represent the following: red triangles, fish farms fallowing in spring in odd years; red circles, fish farms fallowing in autumn in even years; blue triangles, fish farms fallowing in spring in even years; red circles, fish farms fallowing in autumn in odd years. Information provided by the Norwegian Food Authority. Black circles within each area are the exact locations of the sampling sites

