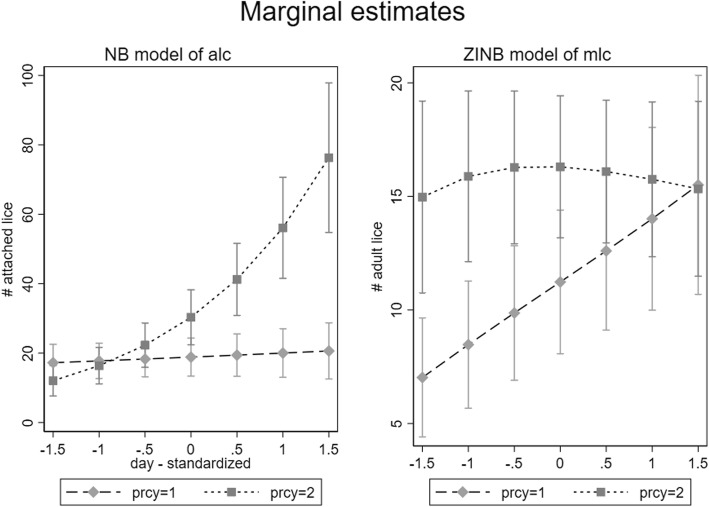
Fig. 6.
Predicted values from a negative binomial model of NliceA (left panel) and a zero-inflated negative binomial model of NliceM (right panel) from Dataset 2. Lines represent the predicted values in years in which the regional aquaculture operations were in their first or second production cycle year (prcy)

