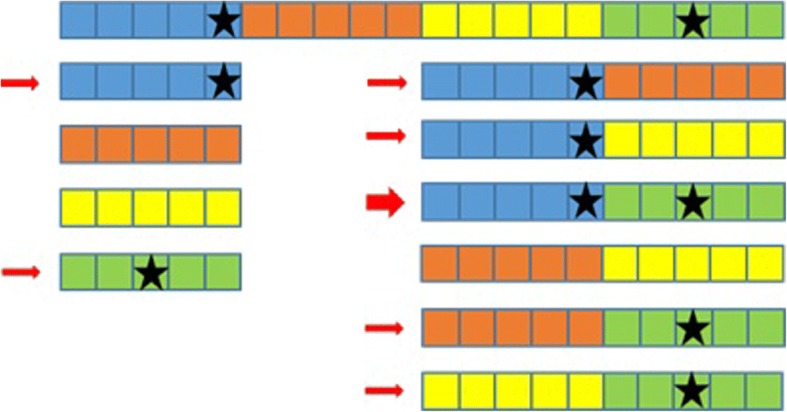
Fig. 3.

An example with 20 SNP (represented by squares) partitioned into 4 groups (represented by the colours) of 5 SNP. The causative SNP are marked with a star. All combinations of 1 or 2 groups are shown, those bearing a causative SNP are marked with a small arrow, and the optimal with the 2 causative SNP with a big arrow
